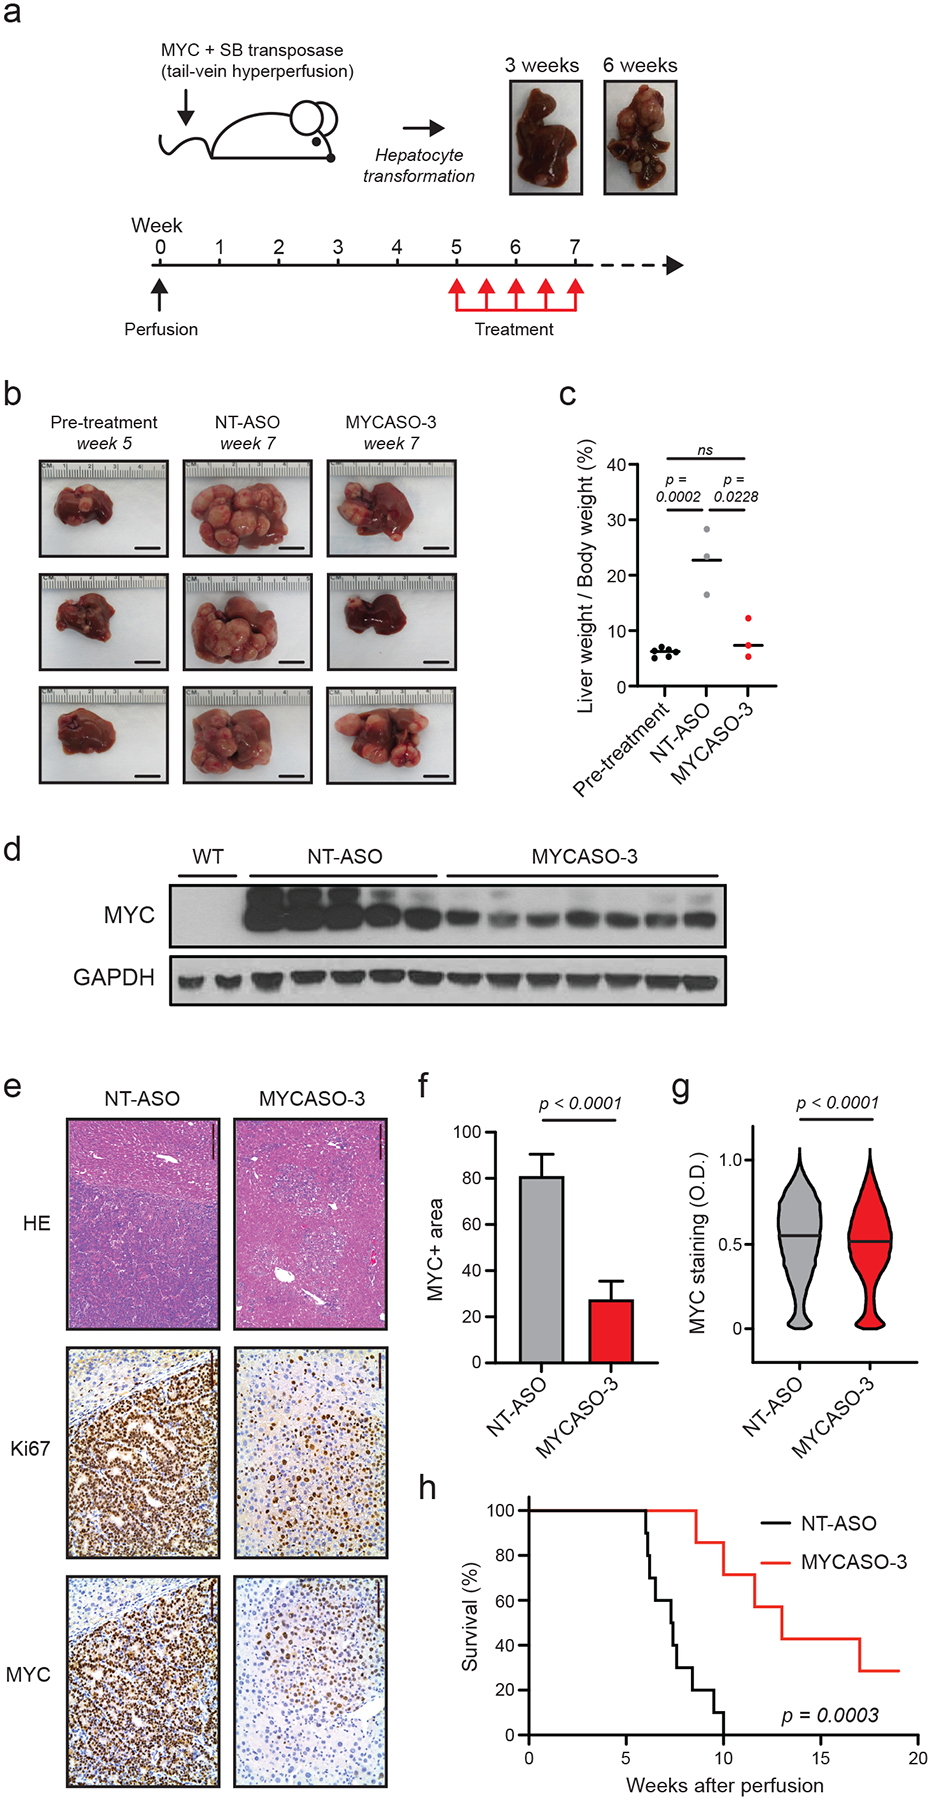
Figure 6: In vivo effects of MYASO-3 in a MYC-induced model of hepatocellular carcinoma.

(a) Schematic of HCC tumor model used to assess MYCASO-3 effects. A plasmid expressing human MYC is co-injected with a plasmid expressing the Sleeping Beauty transposase by hydrodynamic injection. Liver tumor formation is observed by three weeks following perfusion, with large tumor masses observable by 6 weeks. MYCASO-3 was dosed at 25 mg/kg in mice beginning 5 weeks after perfusion, and dosing was performed every 3 days for a period of 2 weeks (a total of 5 doses). (b) Example harvested livers from pre-treatment (5 weeks after perfusion; n=6), NT-ASO treated (7 weeks after perfusion; n=3), and MYCASO-3 treated mice (7 weeks after perfusion; n=3). (c) Ratios of liver weight to body weight in pre-treatment (n=5), NT-ASO treated (n=3), and MYCASO-3 treated mice (n = 3). Bars represent mean values. Statistical analysis performed by t test. (d) MYC immunoblotting on extracts from wild-type (WT) liver tissue, tumor tissue from NT-ASO treated mice, and tumor tissue from MYCASO-3 treated mice. (e) HE and immunohistochemistry showing Ki67+ and MYC+ cells in livers of NT-ASO and MYCASO-3 treated mice. (f) Quantification of MYC+ area in (e). Error bars represent +/− SD of the mean of 8 separate tumor sections. Statistical analysis performed by t test. (g) Quantification of MYC+ cell staining in (e). MYC positivity grades on a per cell basis was assigned using automated Aperio Digital Pathology software. Bars represent median values. Statistical analysis performed by t test. (h) Survival of NT-ASO treated and MYCASO-3 treated mice over time (n=10). P value generated by log-rank Mantel-Cox test.
