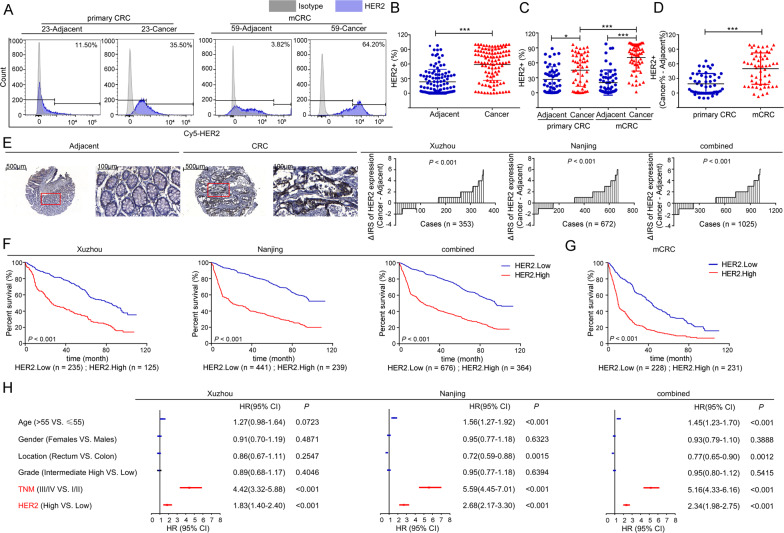
Fig. 2. Expression of HER2 in tissues.
A A total of 106 pairs of fresh CRC tumors and matched adjacent tissues were assessed by flow cytometry analysis, and the representative images are shown. B The expression levels of HER2 in fresh tissues of CRC patients (n = 106, ***P < 0.001, two-tailed t-test). C The expression levels of HER2 in fresh tissues of CRC patients with different progression. (*P < 0.05, ***P < 0.001, Kruskal–Wallis test followed by the Dunn’s multiple comparison test). D The difference in the expression levels of HER2 between fresh CRC tumors and matched adjacent tissues (Cancer% - Adjacent%) of CRC patients with different progression (***P < 0.001, two-tailed t-test). E Left panel: The levels of HER2 in TMA were evaluated by IHC analysis, and the representative staining images are shown. The scale bar is marked in each image. Right panel: The difference in staining score between CRC lesions and adjacent tissues (Cancer - Adjacent) in Xuzhou, Nanjing, and combined cohorts are shown. F KM curves depicting the overall survival of CRC patients based upon tumoral HER2 levels. Left to right: Xuzhou, Nanjing, and combined cohorts. G KM curves depicting the overall survival of mCRC patients based upon tumoral HER2 levels. P values were calculated by the Log-rank test. H Multivariable COX regression analyses (adjusted age, gender, location, grade, TNM stage and HER2 expression) were performed in our cohorts. Bars correspond to 95% confidence interval (CI). HR hazard ratio.

