
Figure 2:
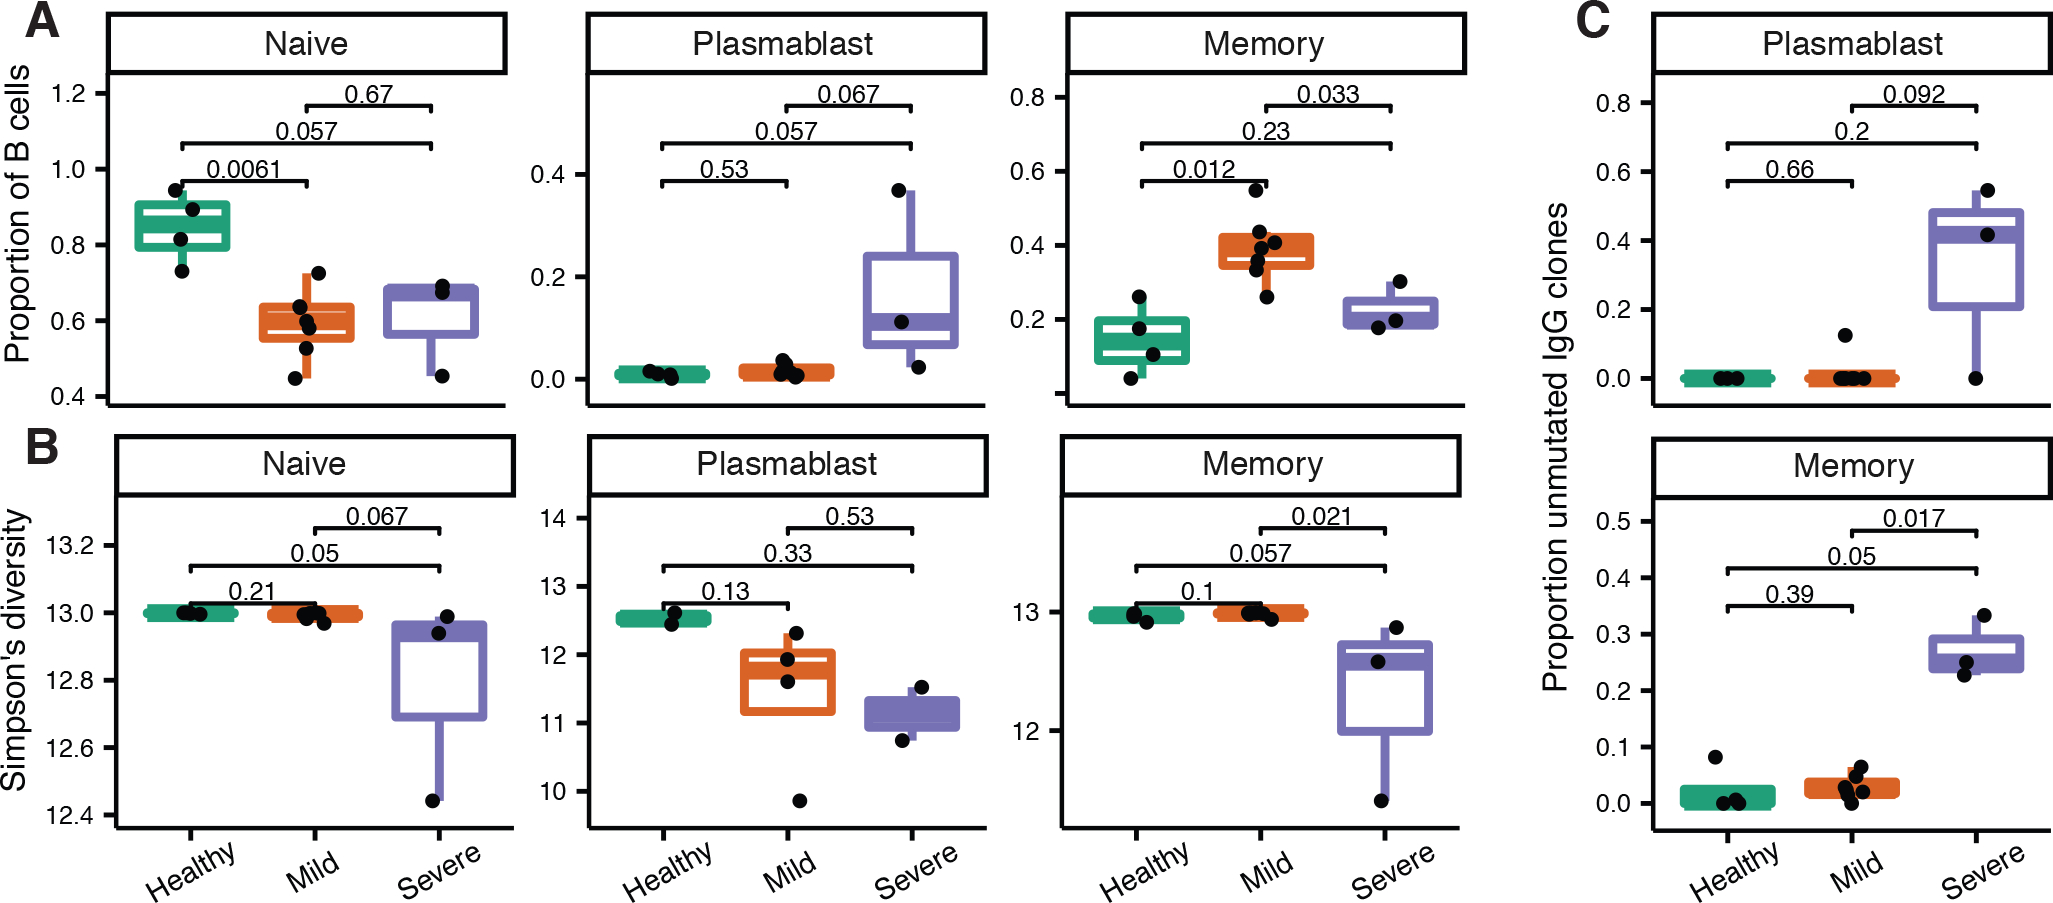
Frequency of B cell subtypes and unmutated B cell clones in all patient cohorts. A) Naive (clusters 0, 1, 3, 5), plasmablast (cluster 7), and memory (clusters 2, 4, 6) B cell frequencies among total B cells in each cohort. B) Clonal diversity of each B cell subset in each cohort. To account for differences in sequence depth among samples, Simpson’s diversity was calculated as the mean over 1000 resampling realizations to a uniform sequence depth among samples and cell type. C) Proportion of IgG B cell clones that are unmutated (median SHM < 1%) in each cohort. The proportion of unmutated IgG clones was not considered for cells within naive B cell clusters, because these likely represent a small number of mis-clustered cells (Supplemental Fig. 3A). P values in all panels were calculated using a Wilcoxon test.