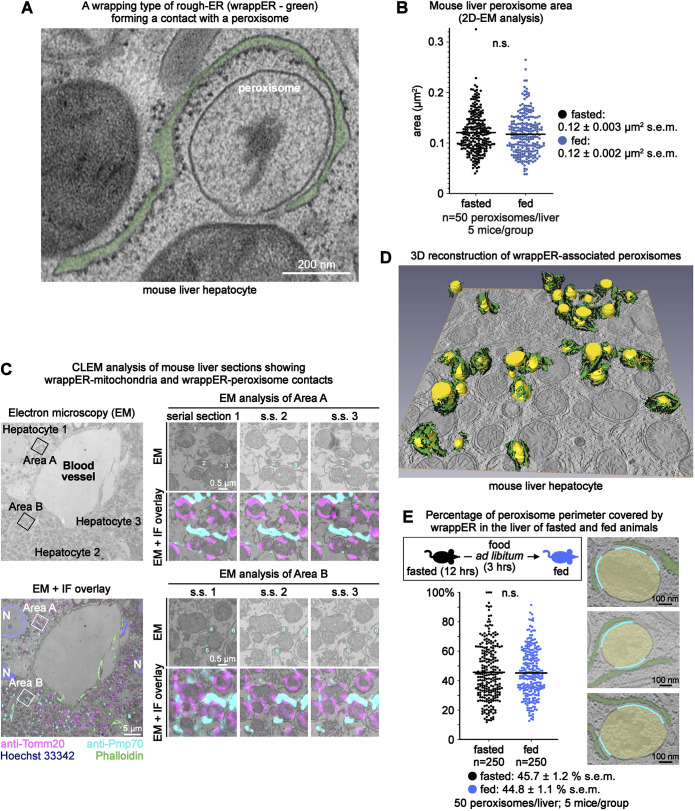
Fig. 1.
Extensive WrappER-peroxisome contacts in mouse liver hepatocytes. (A) Transmission electron microscope image showing a wrappER-peroxisome contact. (B) Dot plot of the data collected by the quantitative electron microscope (EM) morphometric analysis showing peroxisome area in the liver of fasted (14 h) and fed mice (3 h postprandial). (C) CLEM analysis of mouse liver hepatocytes showing wrappER-mitochondria and wrappER-peroxisome contacts. The lower left panel shows an overlay of electron microscope and immunofluorescence (IF) images. The right panels show high magnification images of peroxisomes and mitochondria from the indicated areas. (D) SSET plus three-dimensional reconstruction analysis of wrapping rough ER (wrappER; green, with black ribosomes) associated with peroxisomes (yellow). (E) Percentage of peroxisome perimeter covered by wrappER in hepatocytes of livers collected from fasted and fed mice. In the electron microscope images on the right, the cyan line labels the portion of the peroxisome perimeter that is in contact with the wrappER. The P values were calculated by a two-tailed, unpaired Student's t-test. Data were collected from mouse livers at 3 h postprandial, unless otherwise indicated.

