Fig. 2.
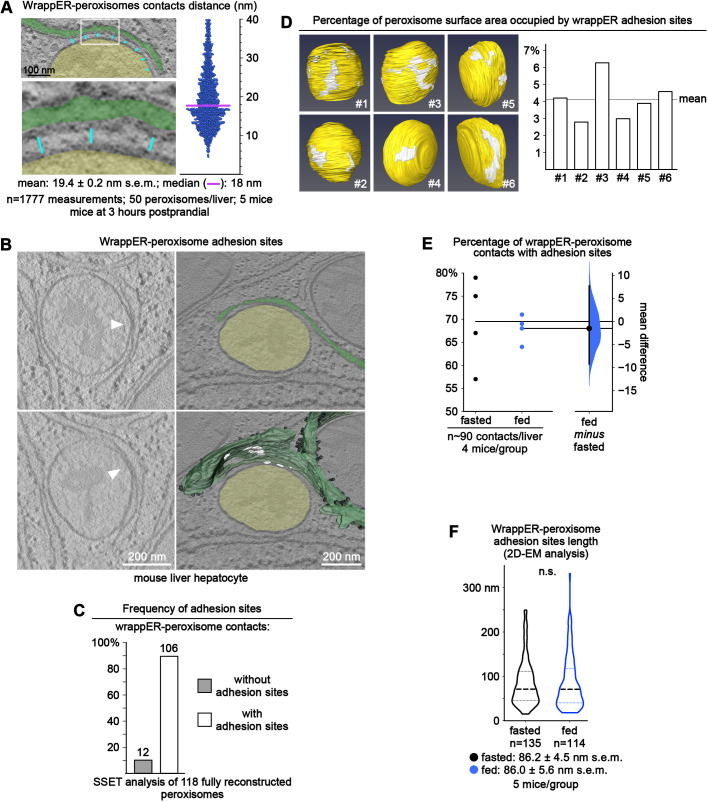
The wrappER-peroxisome contact contains MAM-like domains and adhesion sites. (A) Dot plot of the wrappER-peroxisome contact distance; the line denotes the median distance separating these organelles (18 nm). This analysis was completed by measuring the distance between wrappER and peroxisome every 100 nm (cyan lines), as depicted in the left panels. Ribosome-containing long-range contacts (40-60 nm) were not included in this analysis. (B) SSET analysis showing that the wrappER-peroxisome contact contains adhesion sites. The images on the left are two consecutive virtual slices from a tomogram showing sites of physical contact (adhesion sites, white arrows) between wrappER (green) and peroxisome (yellow). Lower right: three-dimensional reconstruction of the wrappER with the adhesion sites (white areas). (C) Frequency of adhesion sites in wrappER-peroxisome contacts. The data were collected from SSET analysis of 118 fully reconstructed peroxisomes that have a contact with the wrappER (from ten tomograms). (D) Area occupied by wrappER peroxisome adhesion sites on the surface of six peroxisomes. The data were collected from SSET plus three-dimensional reconstruction analysis. Data are expressed as a percentage (4.1±1.3%; mean±s.d.). (E) Fasting-to-feeding transition does not change the percentage of wrappER-peroxisome contacts with ≥1 adhesion site (n=∼90 wrappER-peroxisome contacts/liver, five mice/group; each dot indicates the value per liver). Data were analyzed by estimation statistics and plotted in a Gardner–Altman graph; the mean difference is indicated by the dot on the right panel and is plotted as a bootstrap sampling distribution. The 95% c.i. is indicated by the vertical error bar (Bernard, 2019; Ho et al., 2019). (F) Violin plot of the data collected by quantitative electron microscope (EM) morphometric analysis investigating the average length of wrappER-peroxisome adhesion sites in the liver of fasted and fed mice (n=135 measurements, five mice/group). The P value was calculated by a two-tailed, unpaired Student's t-test. Data were collected from mouse livers at 3 h postprandial, unless otherwise indicated.

