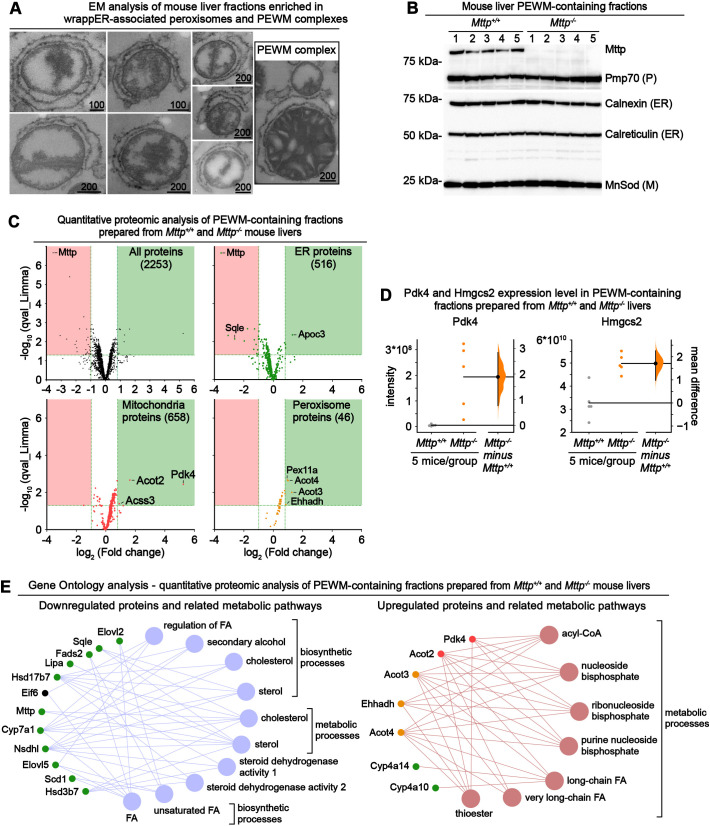
Fig. 4.
Comparative quantitative proteomic analysis of PEWM complexes containing fractions isolated from control and Mttp−/− mouse livers. (A,B) Electron microscopy (EM) (A) and immunoblot (B) analysis of mouse liver fractions enriched in wrappER-associated peroxisomes and PEWM complexes. Scale bars indicate values expressed in nm. ER, endoplasmic reticulum; M, mitochondria; P, peroxisome. (C) Volcano plot comparing the quantitative proteomic analysis of fractions enriched in PEWM complexes isolated from control Mttp+/+ and Mttp−/− mice (n=5). The upper left panel plots all the proteins identified by label-free LC-MS/MS analysis; the other panels display only the proteins assigned to the indicated organelle. Proteins that are upregulated and downregulated in a statistically significant manner are plotted in the green and red boxes, respectively (q-value <0.05; fold change <0.5 and >1.76). (D) Estimation statistics analysis (Bernard, 2019; Ho et al., 2019) of the expression level of Pdk4 and Hmgcs2 proteins in PEWM complex-enriched fractions analyzed by quantitative proteomic analysis. Pdk4 is a negative regulator of pyruvate respiration (Grassian et al., 2011), and Hmgcs2 is a positive regulator of mitochondrial fatty acid β-oxidation (Puchalska and Crawford, 2017). Each dot indicates the expression level of the indicated protein in one sample. In the y-axis, the intensity refers to the quantity of peptides that make the analyzed protein. Data were plotted using the Gardner–Altman graph; the mean difference is indicated by the dot on the right panel and is plotted as a bootstrap sampling distribution. The 95% c.i. is indicated by the vertical error bar. (E) Gene ontology analysis of the data plotted in C showing the metabolic pathways downregulated (left) and upregulated (right) by the loss of Mttp expression. Data were collected from mouse livers at 3 h postprandial.

