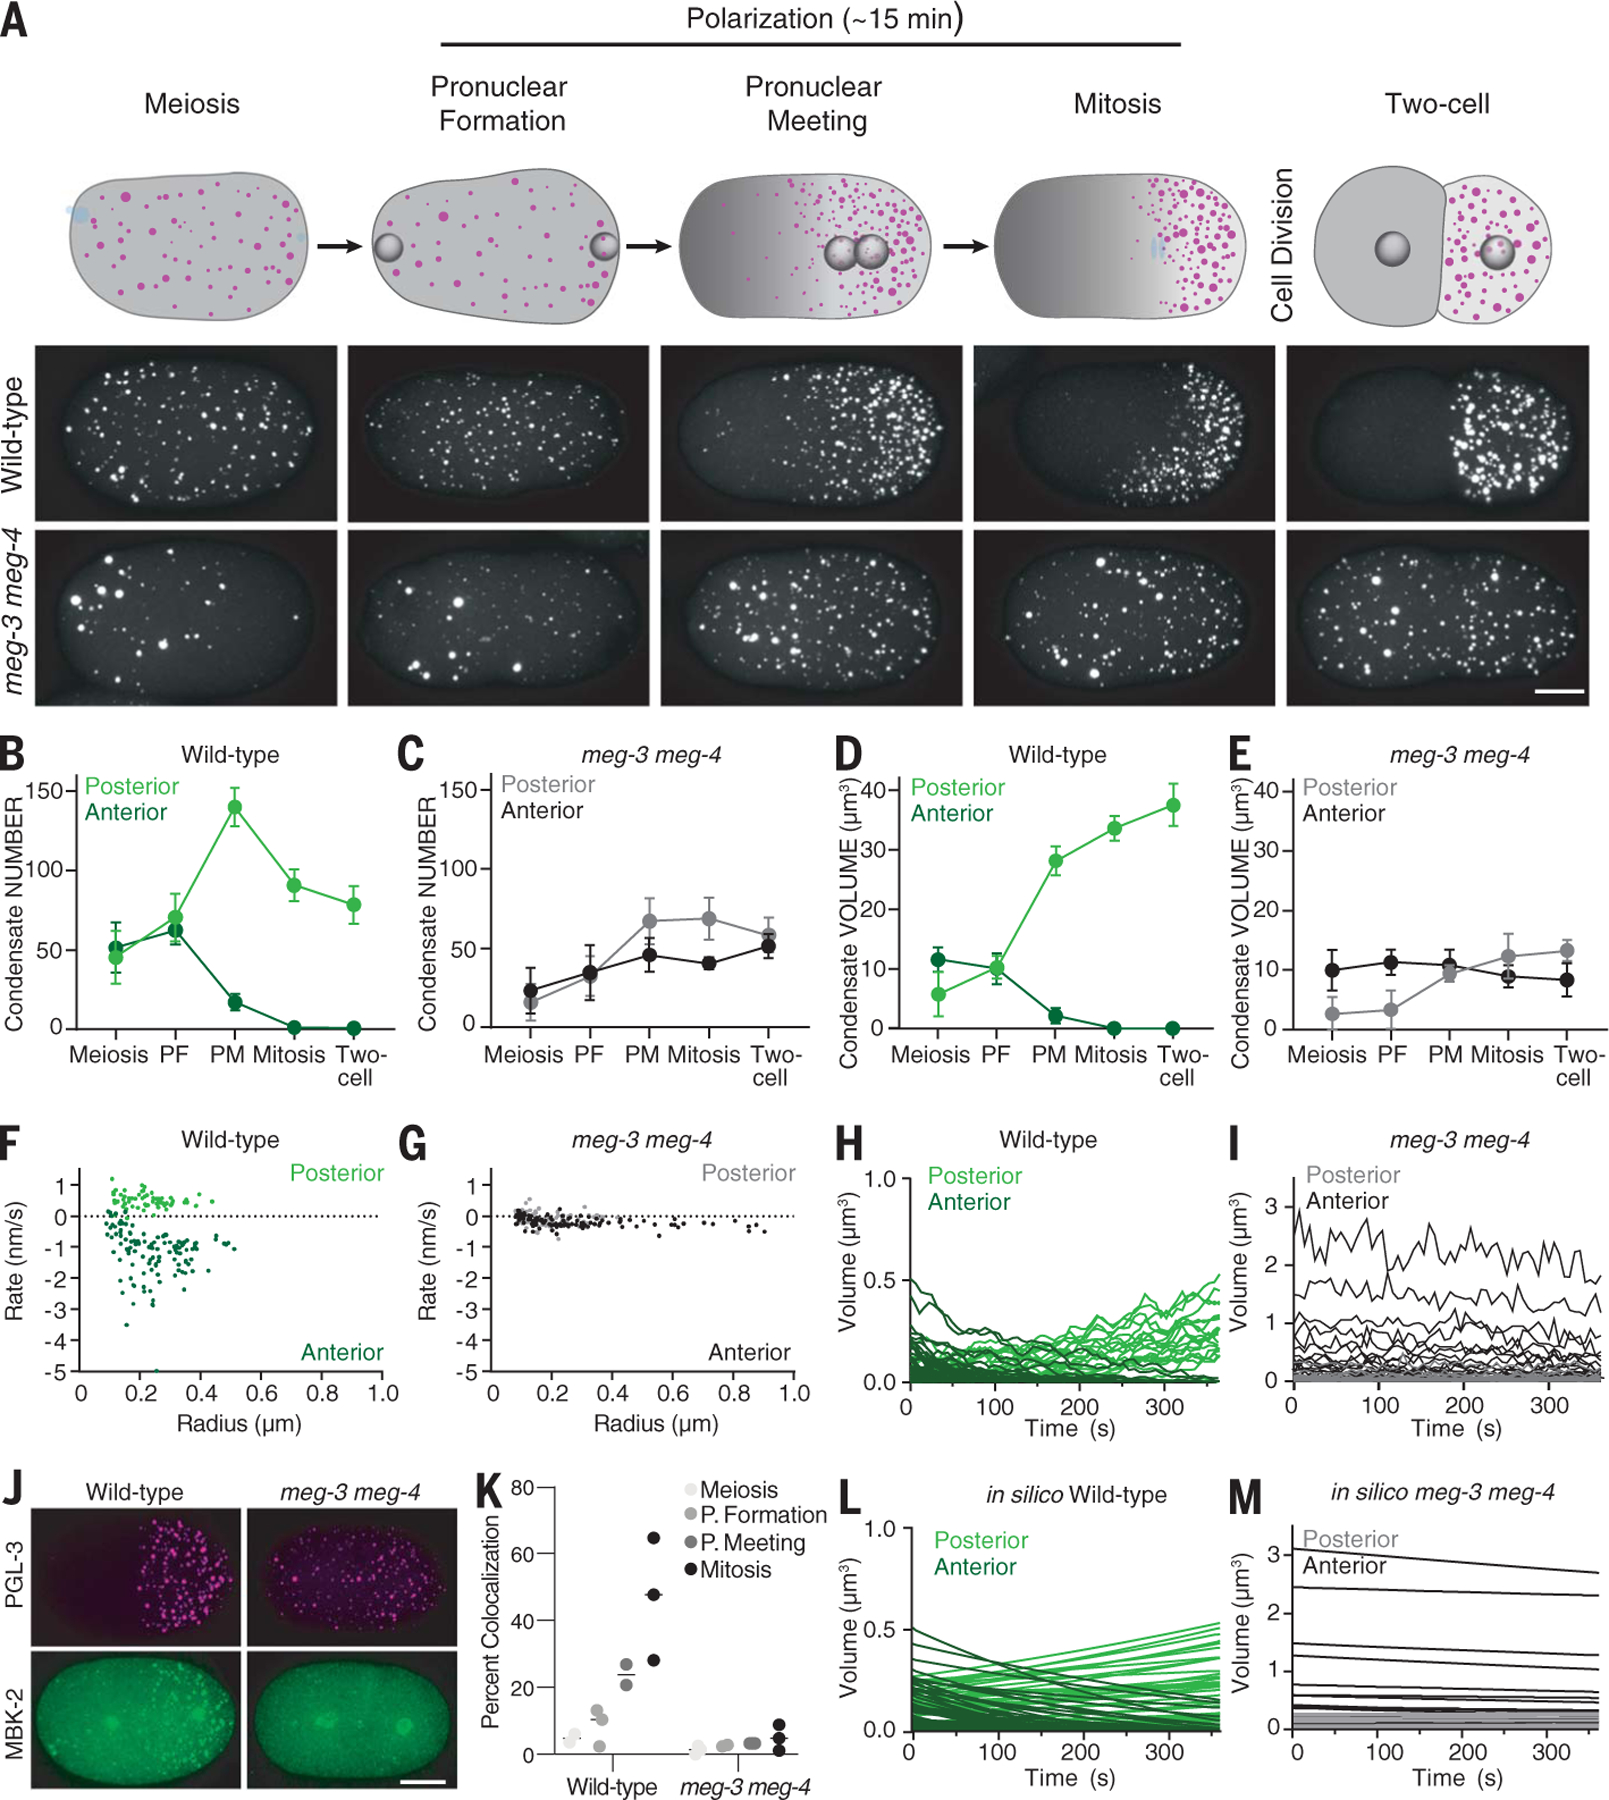
Fig. 5. MEG-3 and MEG-4 drive asymmetric growth of the P granule emulsion during polarization.

(A) Top row: Cartoons depicting PGL-3 condensates (magenta) and MEX-5 (gray) at different stages during the transition from unpolarized to polarized zygote. Blue represents DNA. Bottom two rows: Photomicrographs of wild-type and meg-3 meg-4 zygotes (ex utero) expressing PGL-3::mCherry (white) and matching the stages shown in the cartoons above. Scale bar is 10 µm and applies to all images. (B to E) Graphs showing the total number [(B) and (C)] and total volume [(D) and (E)] of PGL-3::mCherry condensates in the posterior (light color) or anterior (dark color) half of wild-type and meg-3 meg-4 zygotes calculated from the photomicrographs shown in (A). Circles represent the average from five zygotes, and error bars represent the SD. PF, pronuclear formation; PM, pronuclear meeting. (F and G) Graphs showing the rate of change in radius of PGL-3::mCherry condensates in wild-type and meg-3 meg-4 zygotes calculated from traces shown in (H) and (I). (H and I) Graphs showing the evolution of individual PGL-3::mCherry condensates in anterior and posterior regions during polarization in wild-type and meg-3 meg-4 zygotes. Traces begin at pronuclear formation and end just before pronuclear meeting. (J) Photomicrographs of fixed zygotes (mitosis) of indicated genotypes showing the distribution of MBK-2::OLLAS (green) and PGL-3::mCherry (magenta). Note that, in addition to P granules, MBK-2 localizes to centrosomes. Scale bar is 10 µm and applies to all images in the set. (K) Graph showing the percentage of PGL-3:mCherry condensates colocalized with MBK-2::OLLAS puncta in wild-type or meg-3 meg-4 zygotes at the indicated developmental stages. Each circle represents one zygote (>50 puncta), and each line represents the mean. (L and M) Graphs showing the evolution of individual anterior (dark color) and posterior (light color) PGL-3 condensates under conditions simulating “wild-type” (starting condensate sizes as in wild-type zygotes, high conversion rates, and Pickering agent) and “meg-3 meg-4” (starting condensate sizes as in meg-3 meg-4 zygotes, low conversion rates, and no Pickering agent). Compare with experimental data in (H) and (I).
