Figure 1.

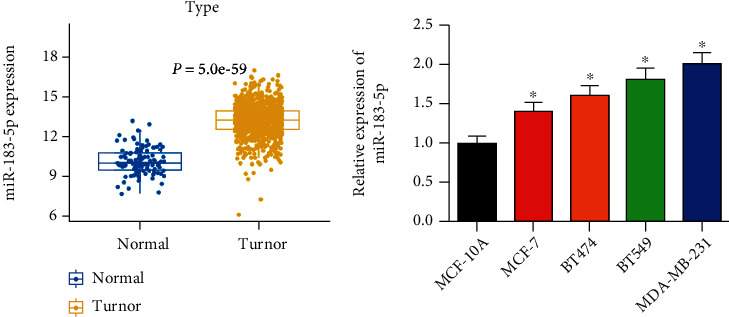
miR-183-5p is activated in BC: (a) boxplot of miR-183-5p expression in the normal group and tumor group; (b) different expressions of miR-183-5p in breast cancer cells shown by qRT-PCR. ∗ represents P < 0.05.

miR-183-5p is activated in BC: (a) boxplot of miR-183-5p expression in the normal group and tumor group; (b) different expressions of miR-183-5p in breast cancer cells shown by qRT-PCR. ∗ represents P < 0.05.