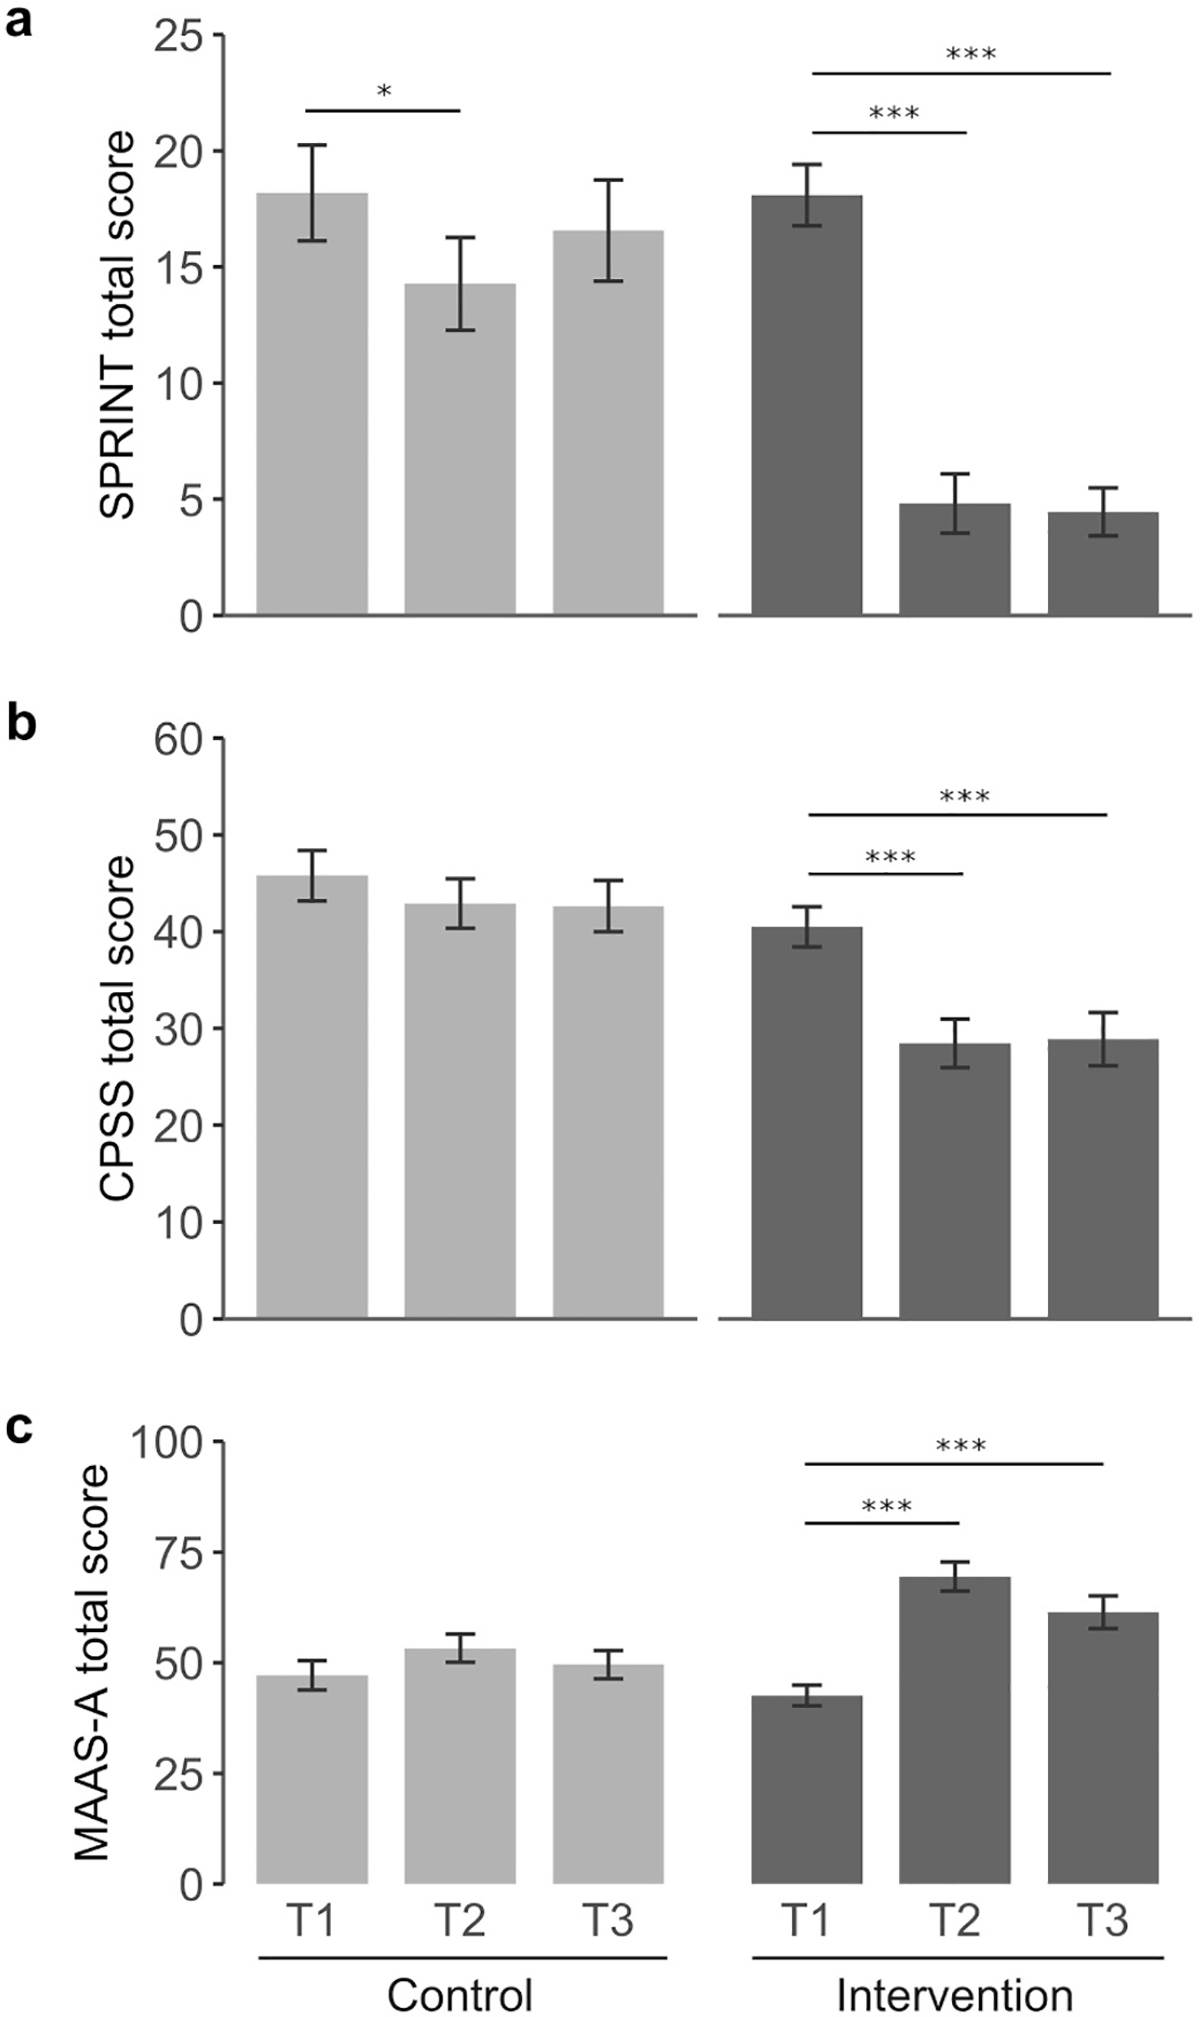
Fig. 3.

Changes in self-report outcome measures in the intervention and control group. Tukey’s post-hoc comparisons were conducted to analyse changes across time in all scales. (a) SPRINT, (b) CPSS and (c) MAAS-A. Light grey (control group); dark grey (intervention group). Mean scores are indicated for each scale. Baseline (T1), post-intervention (T2) and 2-months follow-up (T3). *p < 0.05; ***p < 0.001.
