Fig. 2.

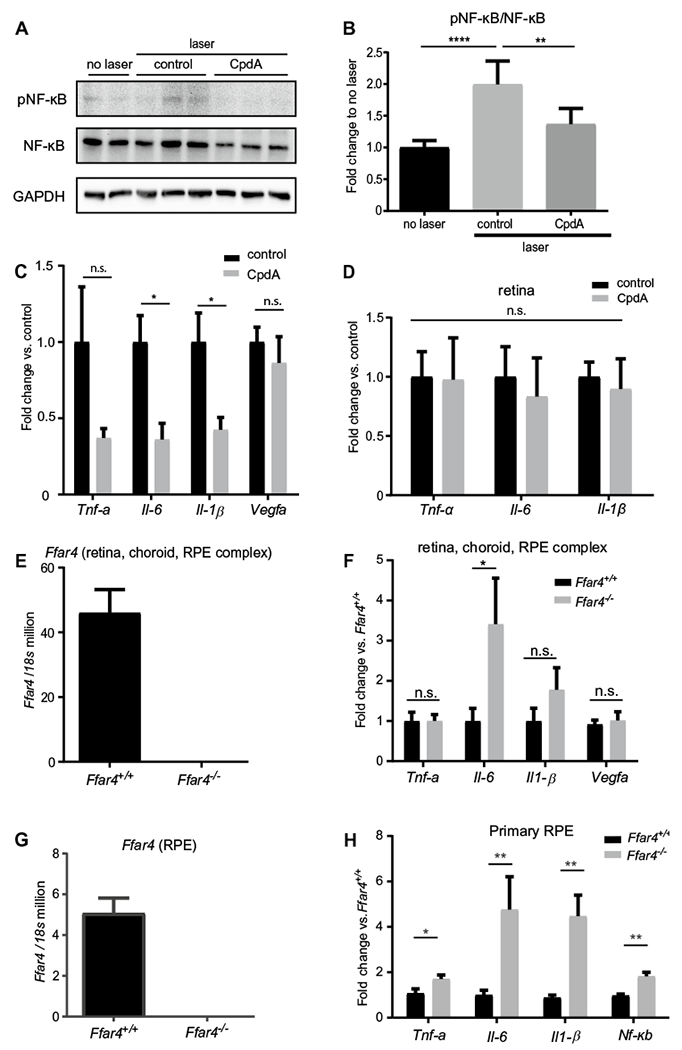
CpdA treatment in mice with laser-induced CNV decreased markers of inflammation. a Representative image of Western blotting analysis of pNF-κB and NF-κB expression in the retina, choroid, RPE complex. b Western blotting quantification: ratio of pNF-κB to NF-κB. The data were presented as the mean ± SE (n = 5–6). c Quantitative (q) RT-PCR analysis of Tnf-α, Il-6, Il-1β, and Vegfa mRNA expression levels in control vs CpdA treatment (n = 6–8). The samples are both retina, choroid, RPE complex. d qRT-PCR analysis of Tnf-α, Il-6, and Il-1β mRNA expression level in control vs CpdA treatment in the retina (n = 3,4). e FFAR4 mRNA expression level in the retina, choroid, RPE complex in Ffar4+/+ vs Ffar4−/− (n = 6). f qRT-PCR analysis of Tnf-α, Il-6, Il-1B, and Vegfa mRNA expression level in Ffar4+/+ vs Ffar4−/− (n = 7–9). g qRT-PCR analysis of Ffar4 mRNA expression level between Ffar4+/+ vs Ffar4−/− littermate mice (n = 4, pooled RPE per group) in the primary RPE. h qRT-PCR analysis of Tnf-α, Il-6, Il-1β and Nf-κb mRNA expression level in Ffar4+/+ vs Ffar4−/− in the primary RPE (n = 4, pooled RPE per group). The data were analyzed by Student’s t-test or ANOVA with Tukey’s multiple comparison test and were expressed as mean ± SE. *p < 0.05; **p < 0.01; ****p < 0.0001; n.s. p > 0.05
