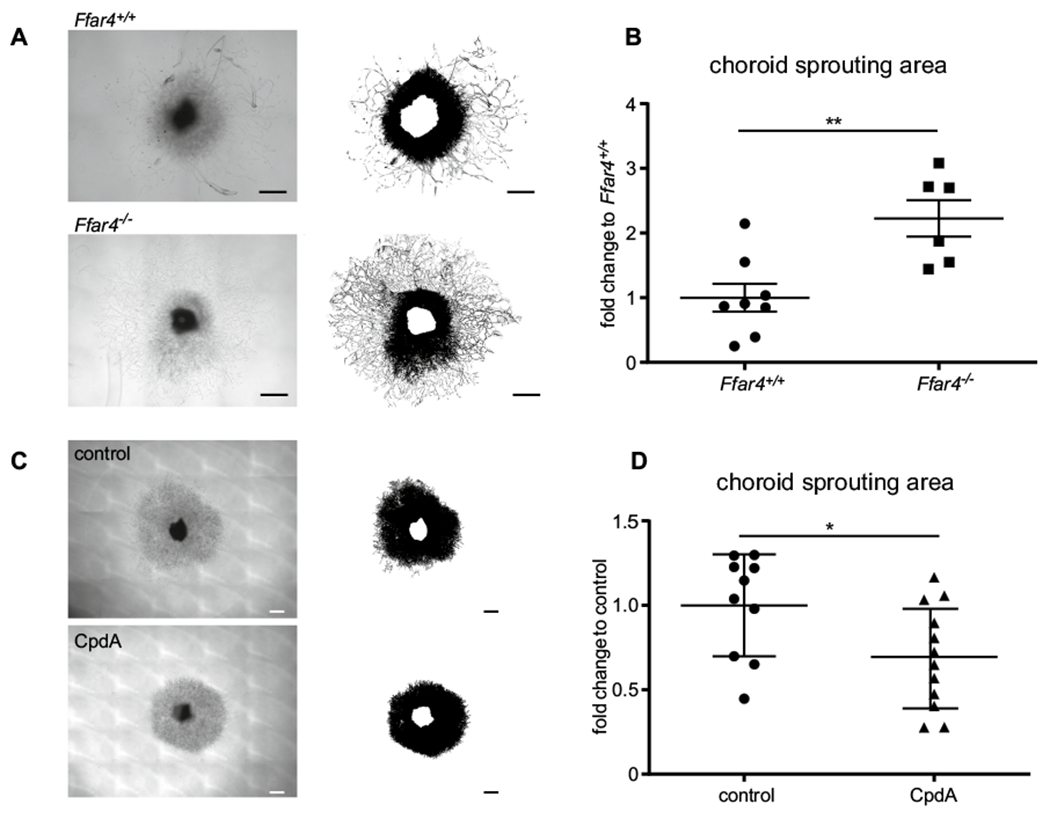
Fig. 3.

CpdA suppressed choroidal neovascularization. a Representative images of the sprouting assay with choroid from Ffar4+/+ vs Ffar4−/− mice: upper image is the choroid of Ffar4+/+, lower image is Ffar4−/− choroid. b Choroid sprouting is increased in Ffar4−/− vs Ffar4+/+ mice (n = 6–8). c Representative images of choroid sprouting: upper image shows vehicle treatment (control); lower image shows CpdA treatment. d CpdA suppressed choroidal sprouting compared to control (n = 10–12). Scale bars = 500 μm. The data were analyzed by Student’s t-test and were expressed as mean ± SE. *p < 0.05; **p < 0.01
