Fig. 1.
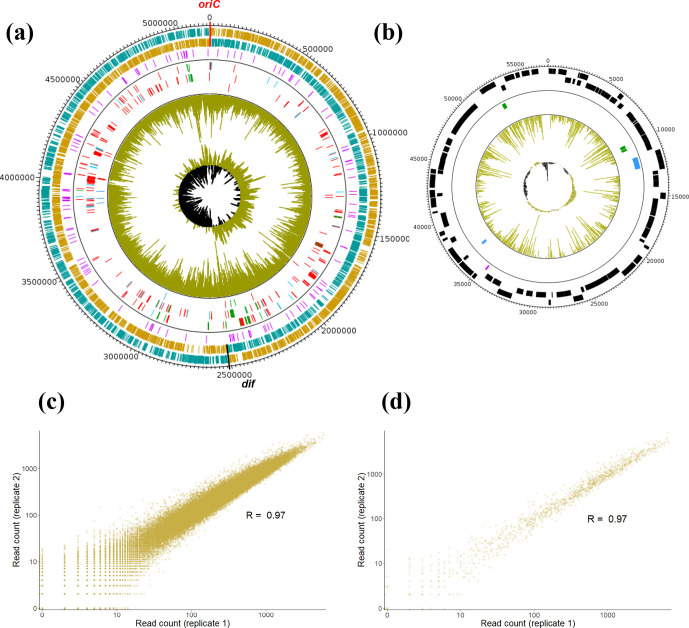
Complete genome atlas of X. hortorum pv. vitians LM16734. The localizations of essential, growth-defect and growth-advantage loci identified by Tn-Seq are indicated on (a) the circular chromosome (5, 213,310 bp) and (b) plasmid pLM16734 (57, 250 bp). The outermost ring track is a clockwise-arranged base pair (bp) ruler, with ticks every 20,000 bp for (a) and every 200 bp for (b). The next two tracks represent predicted protein-coding gene sequences on the forward and reverse strands, respectively. The chromosome replication origin (oriC) and terminus (dif) are marked as red and black ticks in (a), respectively, and protein-coding genes on the leading and lagging strands of replication are shown in orange and blue, respectively. The third (purple) track shows predicted ncRNA sequences on both strands. After the separation line, the next two tracks represent essential (red), growth-defect (blue) or growth-advantage (green) protein-coding genes on the forward and reverse strands, while the sixth track indicates important RNAs with the same colour code. Finally, the seventh track (gold) shows the mean distribution of read counts between the two technical replicates throughout the entire genome, and the eighth track depicts the GC-skew (positive in gold and negative in black). (c, d) Correlations between the two technical replicates of the Tn-Seq experiment. The log-transformed numbers of reads per TA site are plotted and compared between replicates, and Pearson correlation coefficients are indicated for (a) the circular chromosome (R=0.97) and (b) plasmid pLM16734 (R=0.97).

