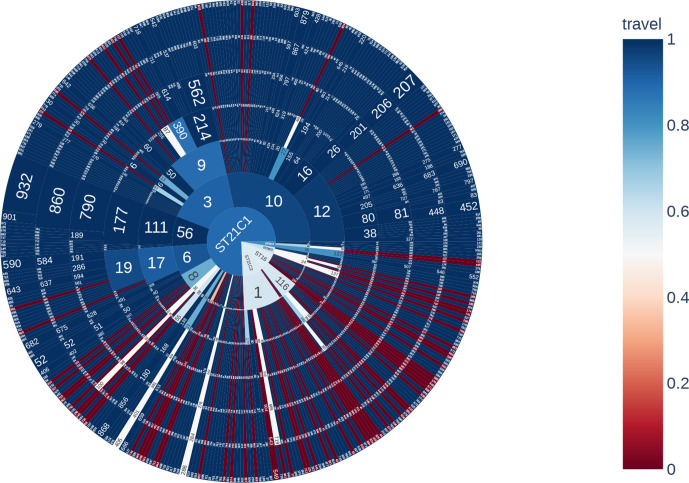
Fig. 4.
Sunburst diagram showing the distribution of isolates belonging to each lineage and sub-lineage, and six descending concentric circles represent single linkage SNP clusters at the 250-, 100-, 50-, 25-, 10- and 5-SNP levels. The segments were coloured based on the proportion of isolates from cases reporting foreign travel within 7 days of the onset of symptoms, with dark blue being no cases reporting recent travel and dark red being all cases reporting recent travel outside the UK.

