
Figure 5. Simulated binding isotherms showing how curve shape varies with KD.
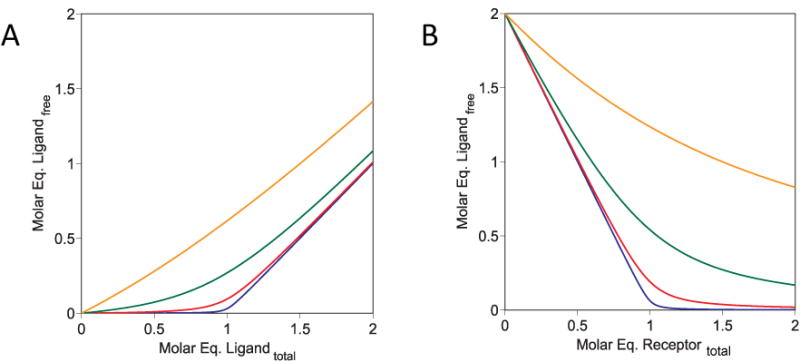
Binding data simulated using the quadratic binding equation with the stoichiometric ratio fixed at 1 arbitrary molar unit. (A) The concentration of receptor was fixed at 1 unit, and the concentration of ligand varied from 0.01 to 100 units. (B) The concentration of ligand was fixed at 1 unit, and the concentration of receptor varied from 0.01 to 100 units. For each isotherm KD was fixed at 0.001 (blue line), 0.01 (red line), 0.1 (green line), or 1 (orange line) units respectively.