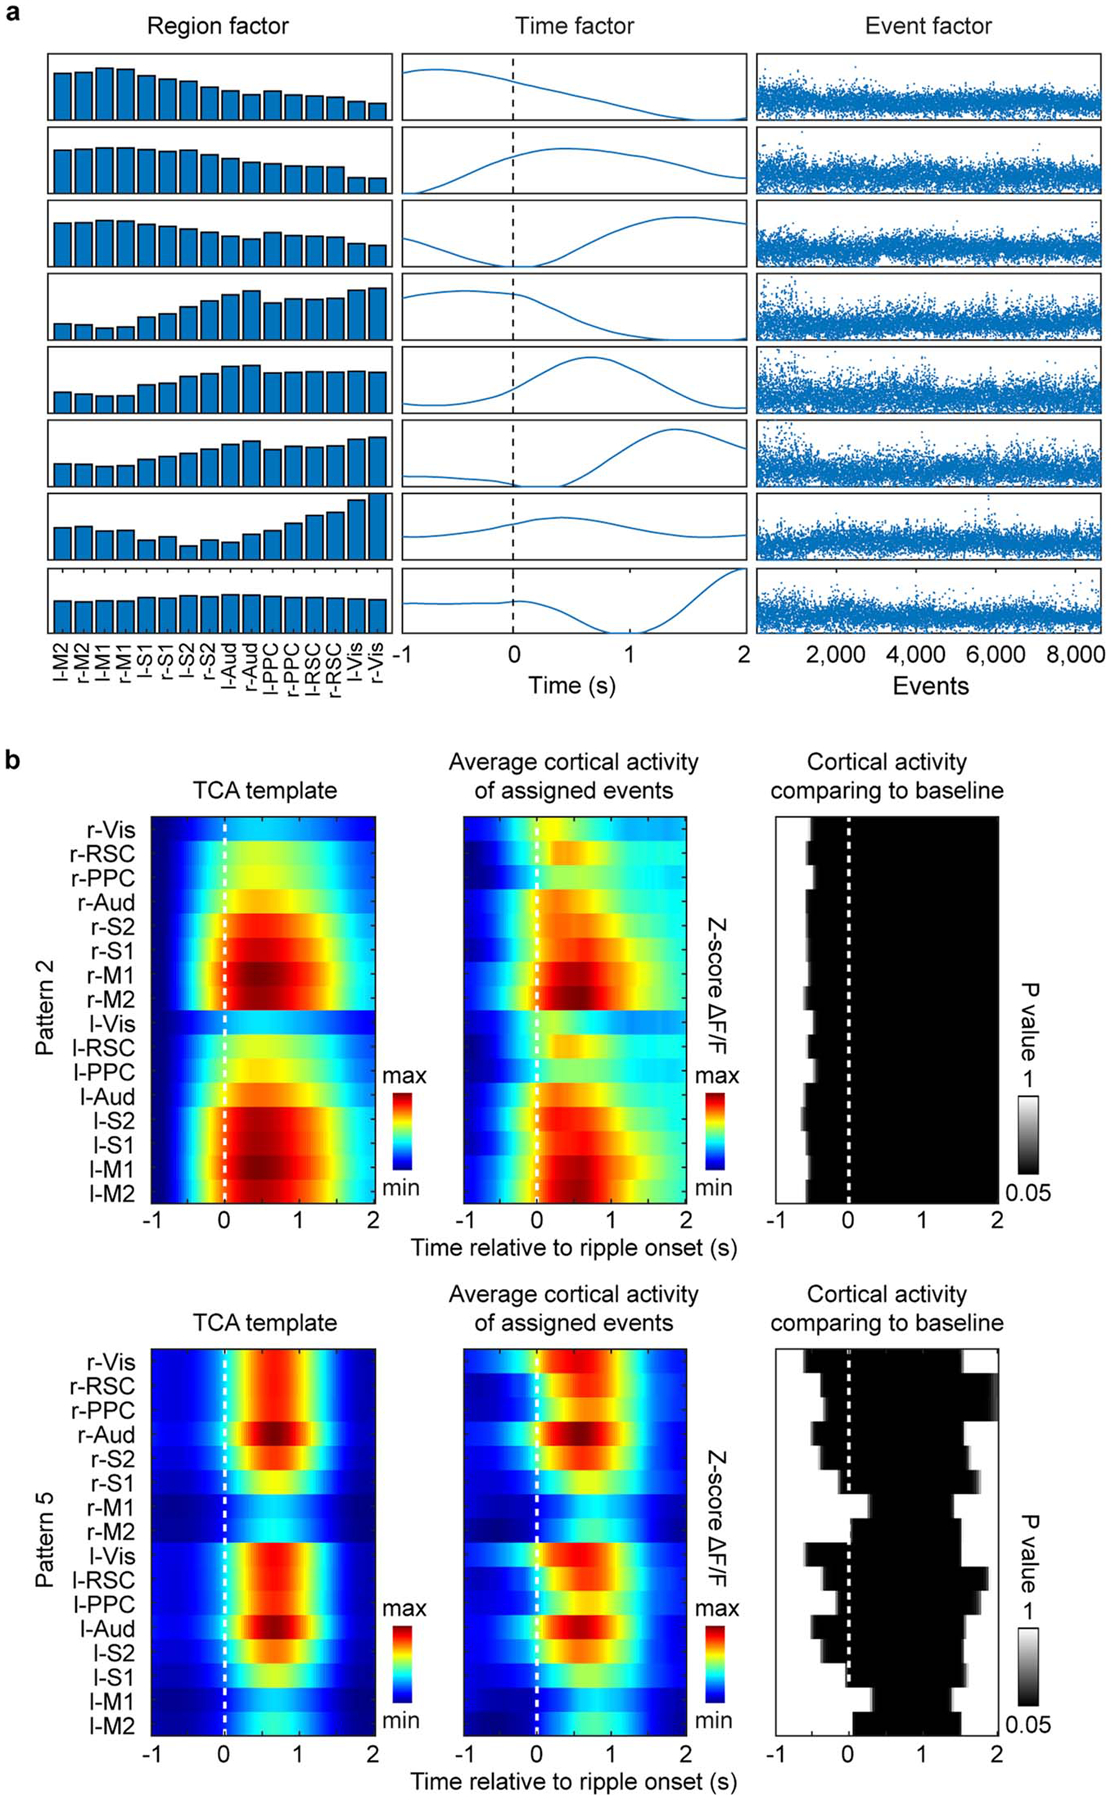
Extended Data Fig. 7. The two-stage TCA result and the cortical activation timing analysis for two patterns.

a, Factors generated by two-stage TCA algorithm. The high-dimensional data of SWR-associated activity from 16 cortical regions was decomposed into 3 factors. The region factors and time factors describe the spatial and temporal dynamics of cortical patterns respectively and the event factors measure the weighting of a given SWR event on the established set of patterns. b, Cortical activation timing for pattern 2 and pattern 5. Shown in each row are the pattern template (left), the average cortical activity for the events assigned to the pattern (middle), and the P-value maps (right) for all the cortical regions at [−1 s, 2 s] time interval aligned to SWR onset, showing significantly higher activity than baseline (−1 s) for most cortical regions.
