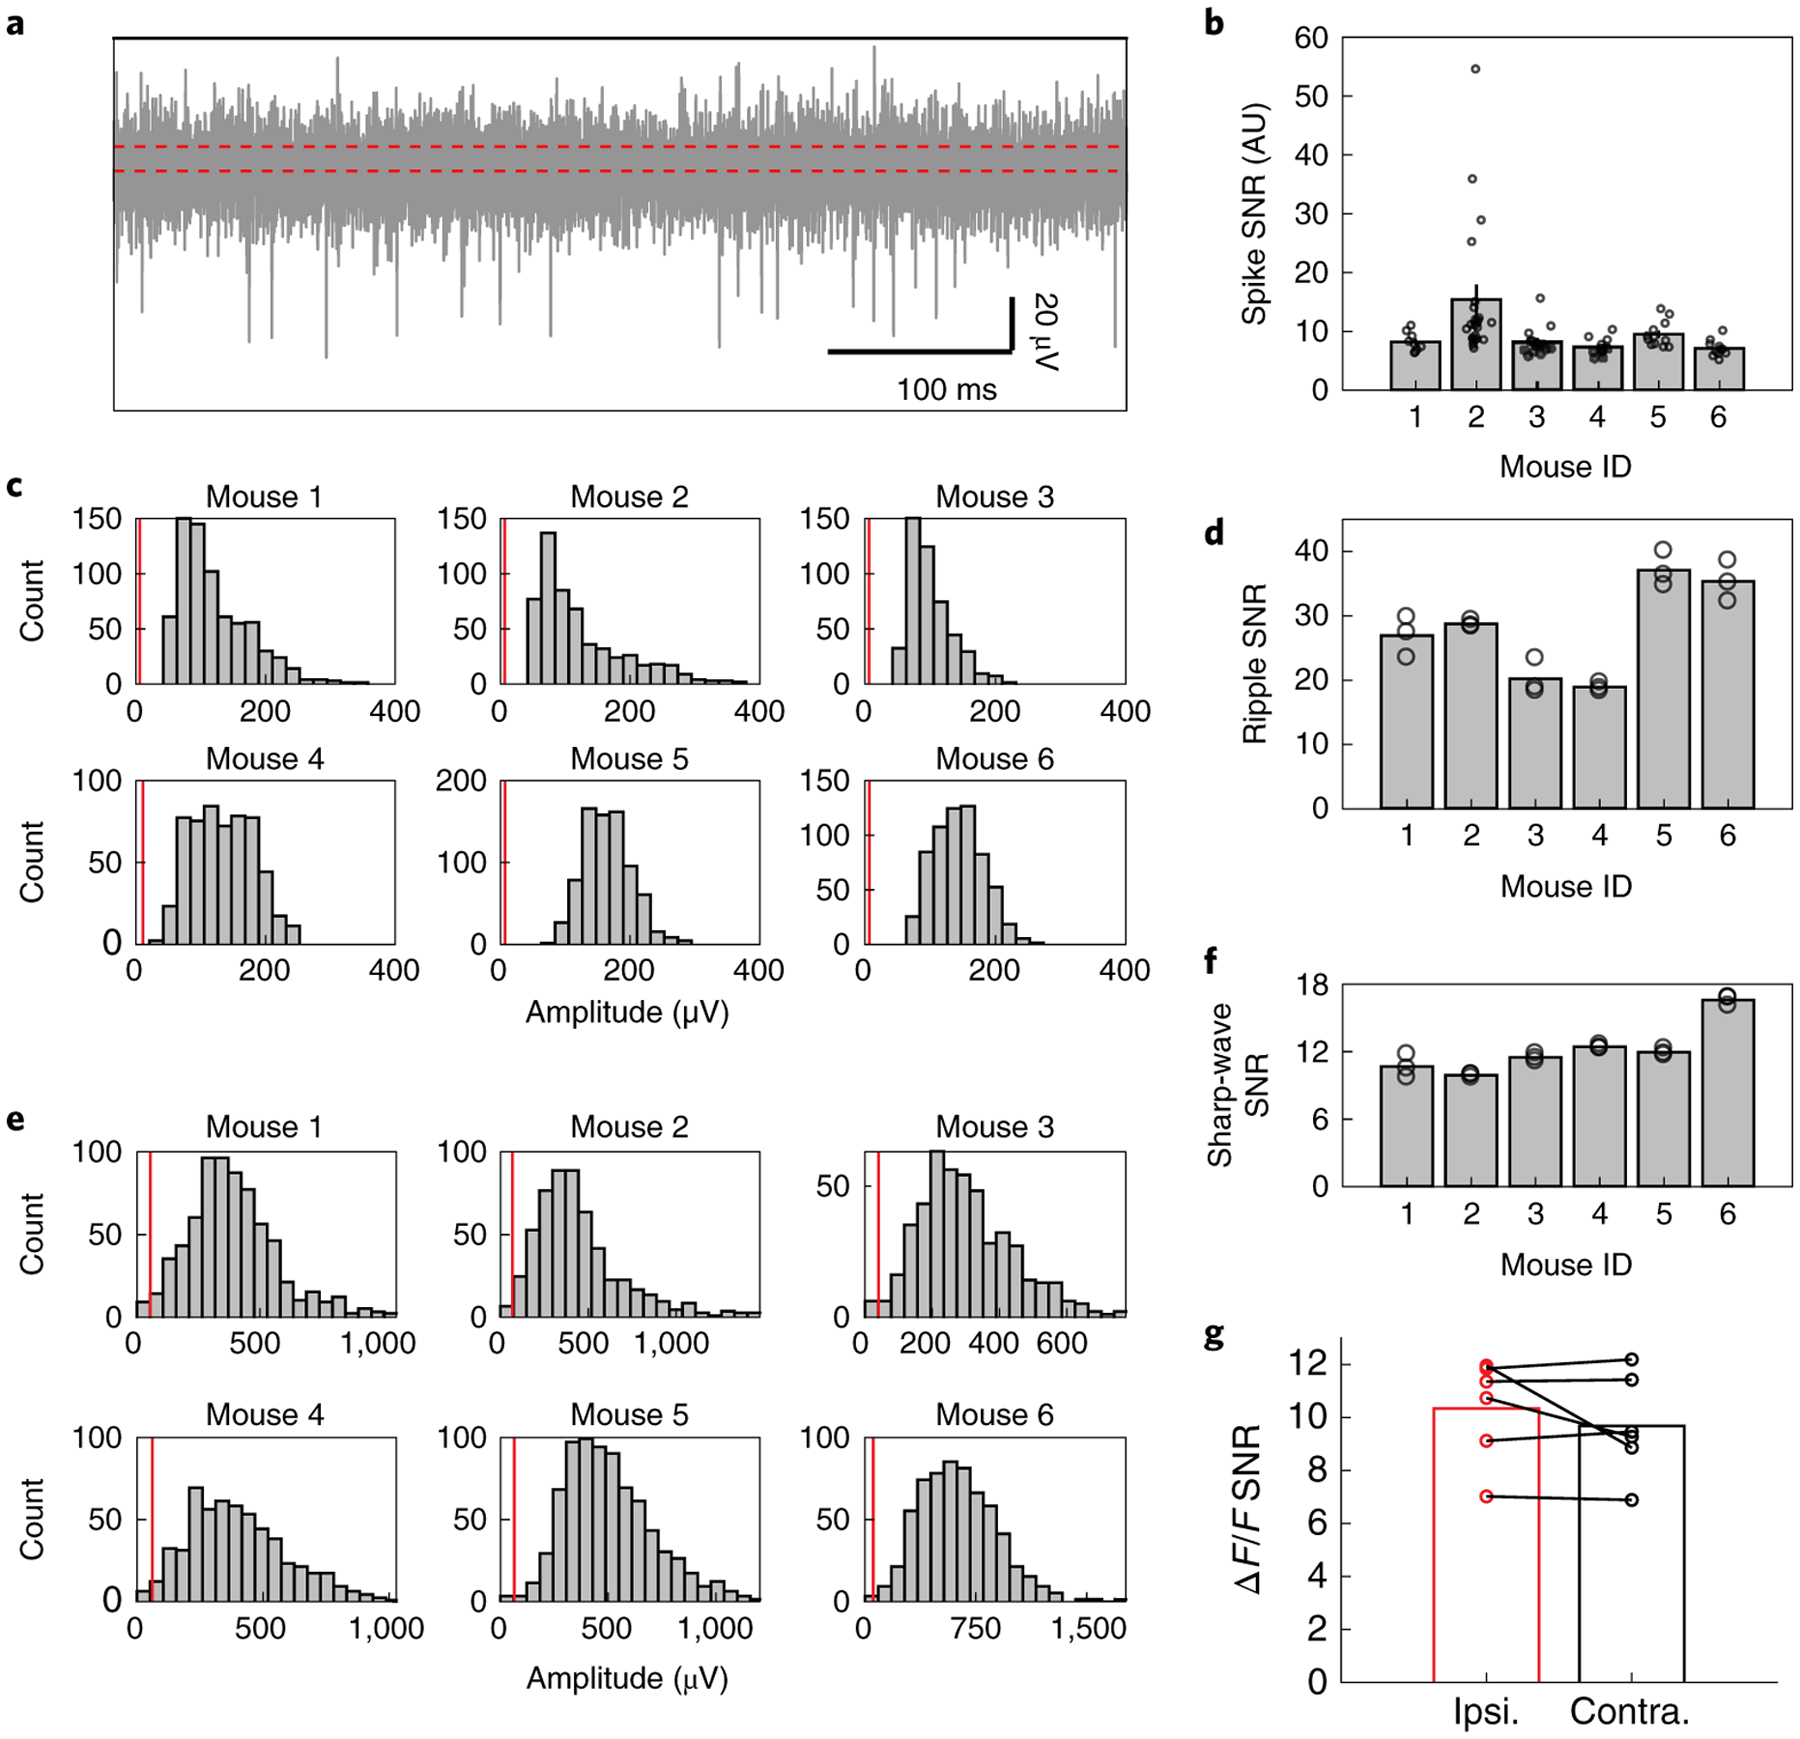
Fig. 4 |. SNR for the spikes, the LFP, and the wide-field fluorescence.

a, Representative example of high-pass filtered data from one channel showing the detection of multiple spikes and the median absolute deviation (MAD) denoted by the width between two red dashed lines.
b, SNR of the recorded spikes in all 6 mice. Bar shows the mean SNR averaged over all the neurons and the error bar denotes the s.e.m. Each dot represents the spike SNR for one neuron.
c, Histogram of amplitude of the detected ripples. The red line shows the MAD of the ripple range LFP (120 Hz – 250 Hz).
d, Mean SNR for the ripples detected in all 6 mice. Each dot represents the mean SNR of the ripples recorded in one recording channel.
e, Histogram of amplitude of the sharp-waves during SWR. The red line shows the MAD of the sharp-wave range LFP (5 Hz – 50 Hz).
f, Mean SNR for the sharp-waves detected in all 6 mice. Each dot represents the mean SNR of the sharp-waves recorded in one recording channel.
g, Signal-to-noise ratio of the ΔF/F for the cortical regions covered by the array shank (ipsilateral) vs. the symmetric cortical regions on the contralateral side, showing similar SNR for both cases.
