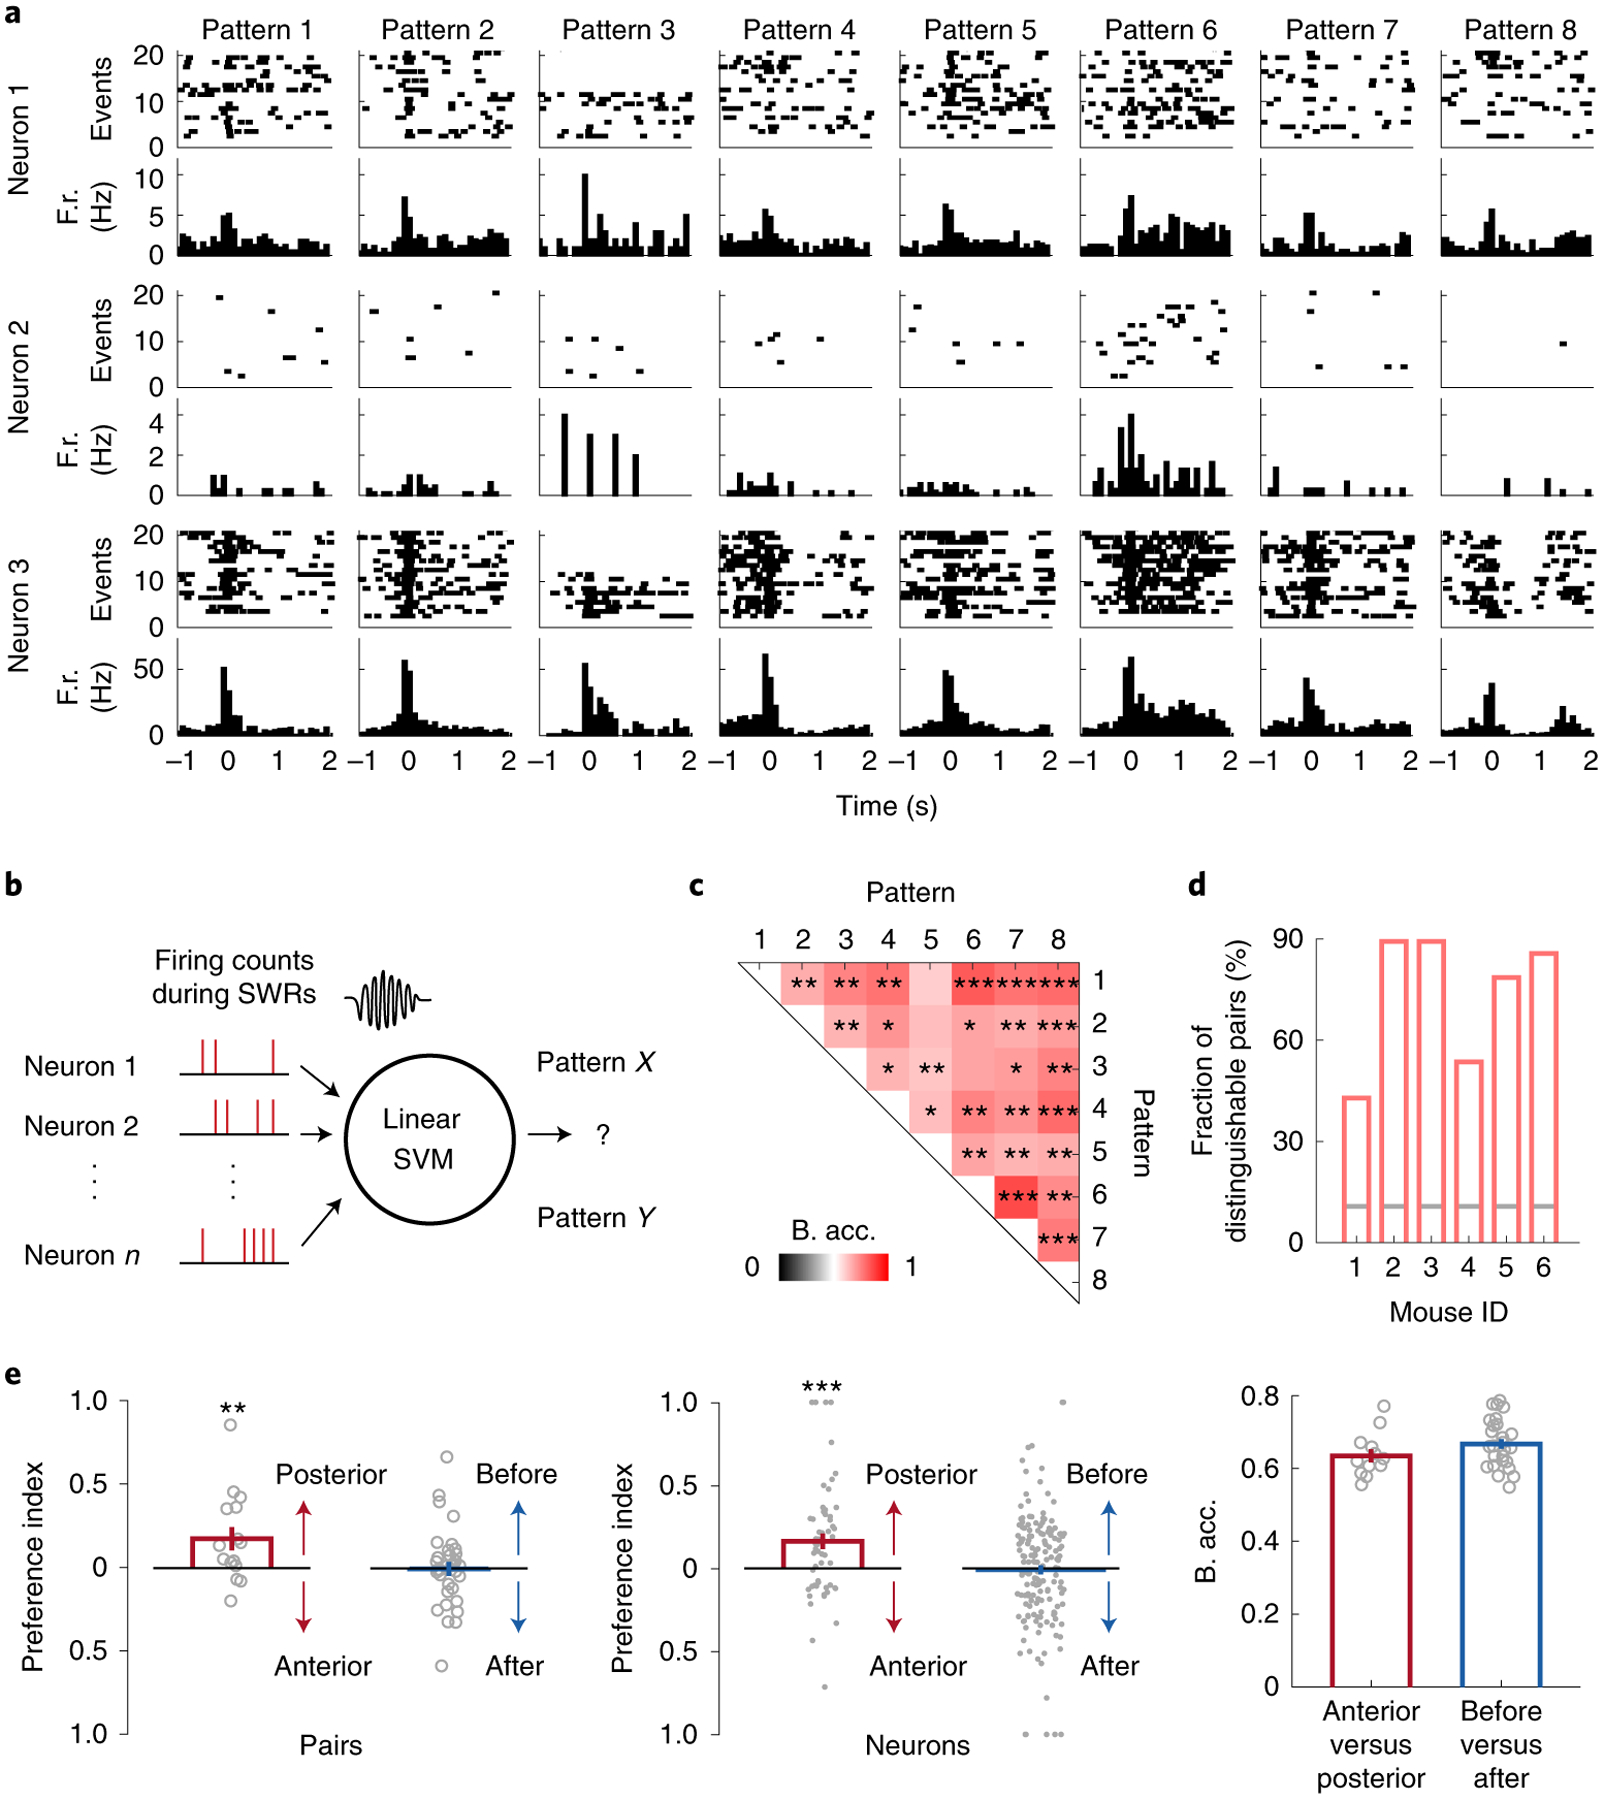
Fig. 7 |. Different cortical activity patterns associated with distinct hippocampal neuronal activity patterns during SWRs.

a, Raster plots (spikes) and the peri-event time histograms of example hippocampal neurons, showing different (Neurons 1 and 2) and similar (Neuron 3) firing rates at SWR onset under different cortical activity patterns. F.r.: firing rate.
b, Schematic of the decoding model. The firing counts of each hippocampal neuron during 0–100 ms relative to SWR onset were used as input features for the linear SVM to decode the cortical patterns.
c, Decoding accuracy of all cortical pattern pairs from one example animal (Mouse 2). Cortical pattern pairs that are significantly distinguishable based on hippocampal activity are marked by asterisks (shuffled 2000 times, one-tailed, *P < 0.05, **P < 0.01, ***P < 0.001, see Methods for exact p values). B. acc.: balanced accuracy.
d, Fraction of distinguishable cortical pattern pairs in each animal. Across 6 animals, many cortical pattern pairs were distinguishable based on the hippocampal neuron activity. Gray lines: the chance level fraction with P < 0.05 (one-sided binomial test, n = 28 pattern pairs). The p-values for mouse 1–6 are 2.24E-10, 5.10E-32, 5.10E-32, 2.60E-14, 9.17E-26, 8.42E-30
e, Preference index and decoding accuracy between anterior(A)-posterior(P) and early(E)-late(L) pattern pairs. Left: preference index of discriminant hippocampal neurons between A-P pairs (pattern 1 vs. 4, 2 vs. 5, and 3 vs. 6) or between E-L patterns (pattern 1 vs. 2, 1 vs. 3, 2 vs. 3, 4 vs. 5, 4 vs. 6, and 5 vs. 6). Posterior patterns were associated with higher firing counts of discriminant neurons than the anterior patterns (two-tailed bootstrap test, 10000 times, **P(A-P) = 0.0017, n = 15 pattern pairs) while no significant differences were detected between early and late patterns (P(E-L) = 0.4646, n = 33 pattern pairs). Gray circles: preference index averaged over all neurons for each pair within each animal. Middle: same as Left but for individual discriminant neurons (two-tailed bootstrap test, 10000 times, ***P(A-P) = 0.0001, n = 56 neurons, P(E-L) = 0.3802, n = 160 neurons). Gray dots: preference index of individual discriminant neurons. Right: Decoding accuracy between A-P and E-L pairs was similar (two-tailed bootstrap test, 10000 times, P = 0.0656, n = 15 pattern pairs for A-P, n = 33 pattern pairs for E-L). All error bars are s.e.m. Gray circles: decoding accuracy for each pair.
