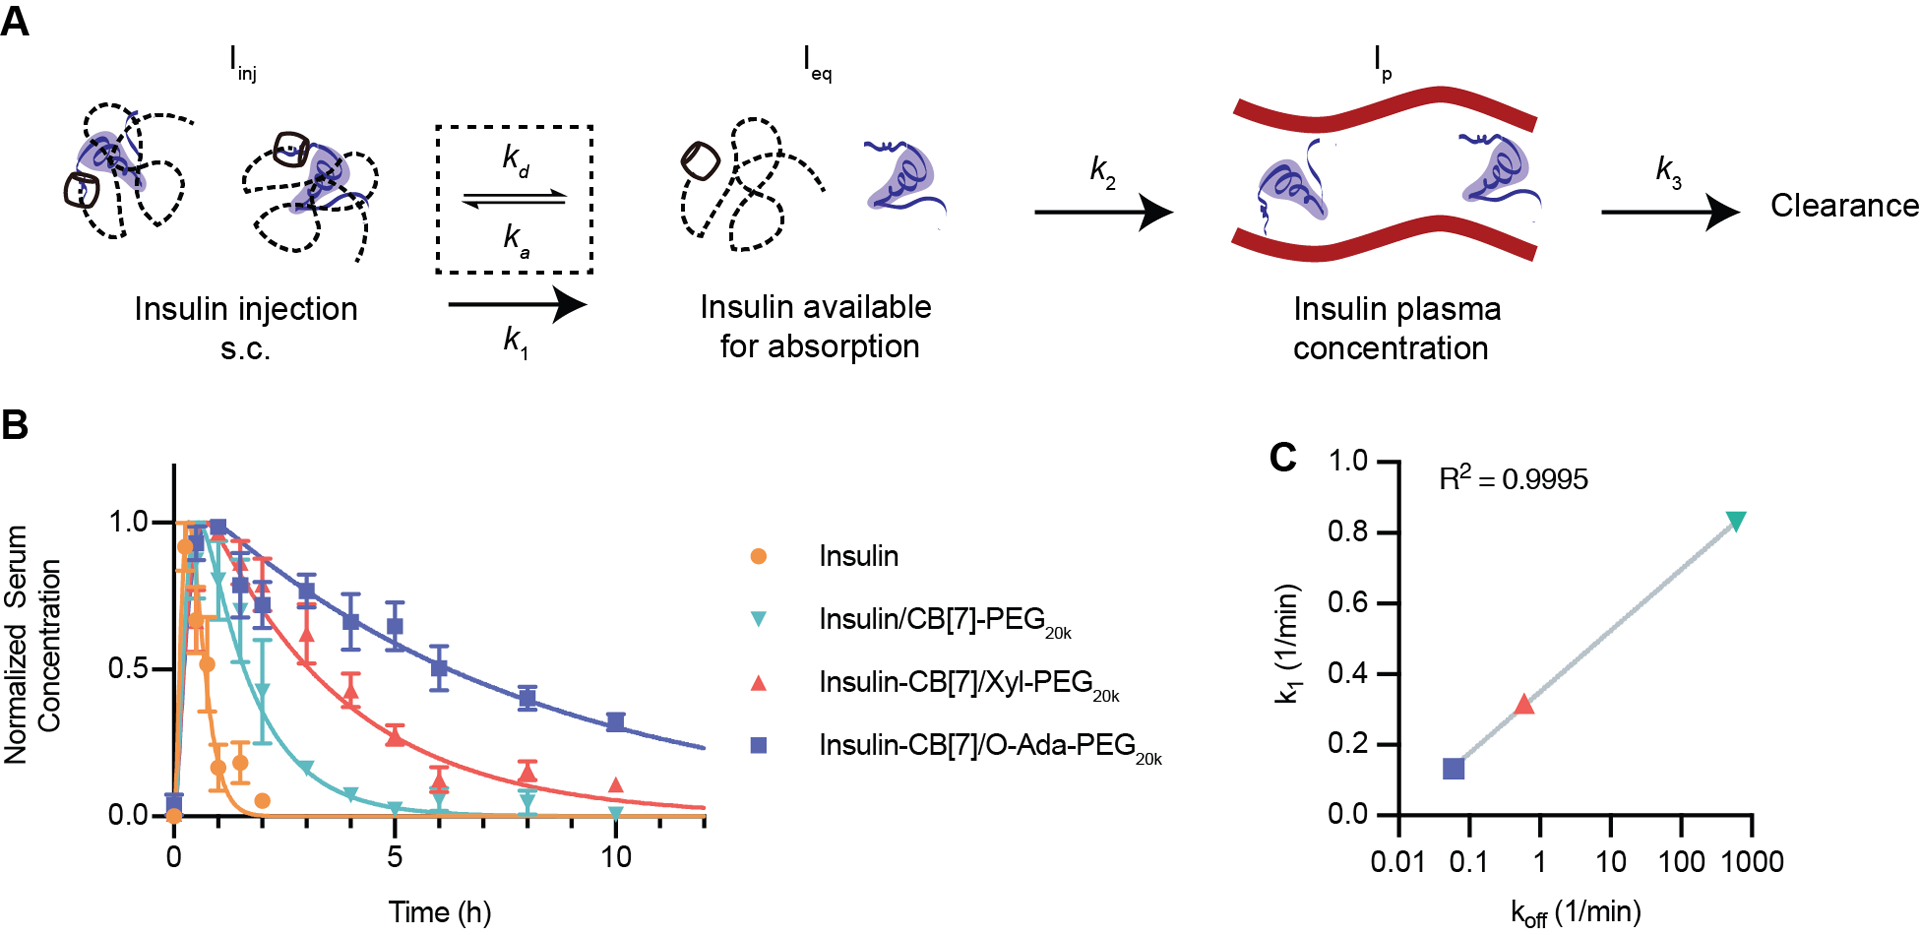
Figure 5: Modeling of formulation pharmacokinetics.

(A) Pharmacokinetic scheme showing a three-compartment model. After injection, insulin will transition dynamically between a PEGylated state (not readily absorbed) and a free state where it is available for absorption into the blood. Available insulin will be absorbed into the blood from the subcutaneous space and then cleared from the blood. (B) Normalized pharmacokinetics in diabetic rats modeled using a least-squares fit to determine k1, and k2, with k3 based on the elimination half-life calculated from intravenous injection experiments. Data is shown as mean ± SEM. (C) k1 (fitted parameter from experimental data) plotted versus koff (calculated based on host–guest binding affinity). A semi-log line was fit to the data using GraphPad Prism 9 best fit: Y=0.1735*log(X)+0.1761, Adjusted R2=0.9995.
