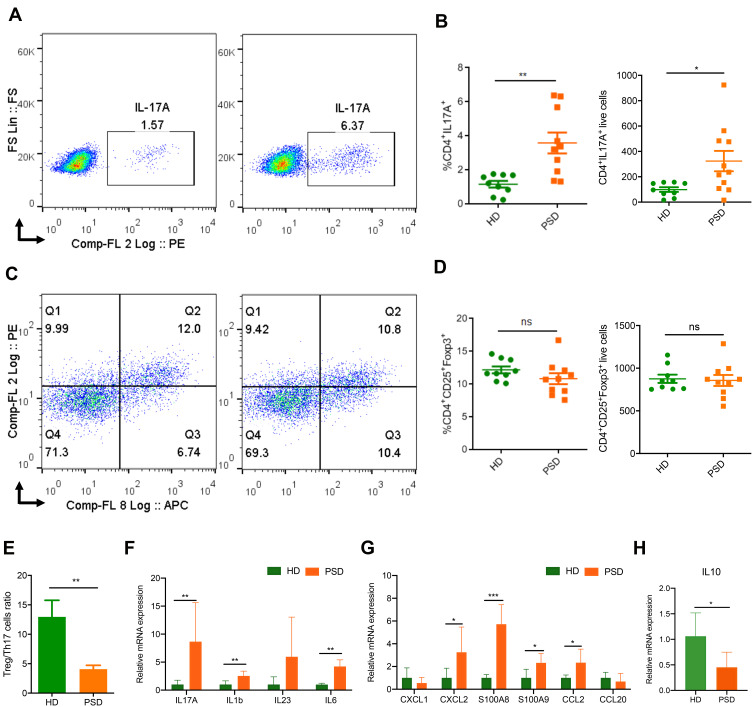
Figure 3.
FMT of feces from healthy donors protects against imiquimod induced Treg/Th17 imbalance. Cells from spleen of HD (donor 2 and 5) and PSD (donor 2, 3 and 5) were isolated and analyzed for Th17. (A) and Treg cells (C) counts. Statistical analysis data (B and D) are shown in the right panel. Each point represents one mouse. Anova & Student t-test statistical analyses of means ± SD: *p < 0.05, **p < 0.01. (E) The Treg /Th17 cells ratio. Anova & Student t-test statistical analyses of means ± SD: ** p < 0.01 (F and G) The mRNA expression levels of cytokines (F) and chemokines (G), including IL17A, IL1b, IL23, IL6, CXCL1, CXCL2, S100A8, S100A9, CCL2 and CCL20 in the skin lesion of the HD and PSD mice after imiquimod treatment (n=6 per group). Anova & Student t-test statistical analyses of means ± SD: *p < 0.05, **p < 0.01, ***p < 0.001. (H) The mRNA level of IL10 in the skin lesion (n=6 per group). Anova & Student t-test statistical analyses of means ± SD: *p < 0.05.

