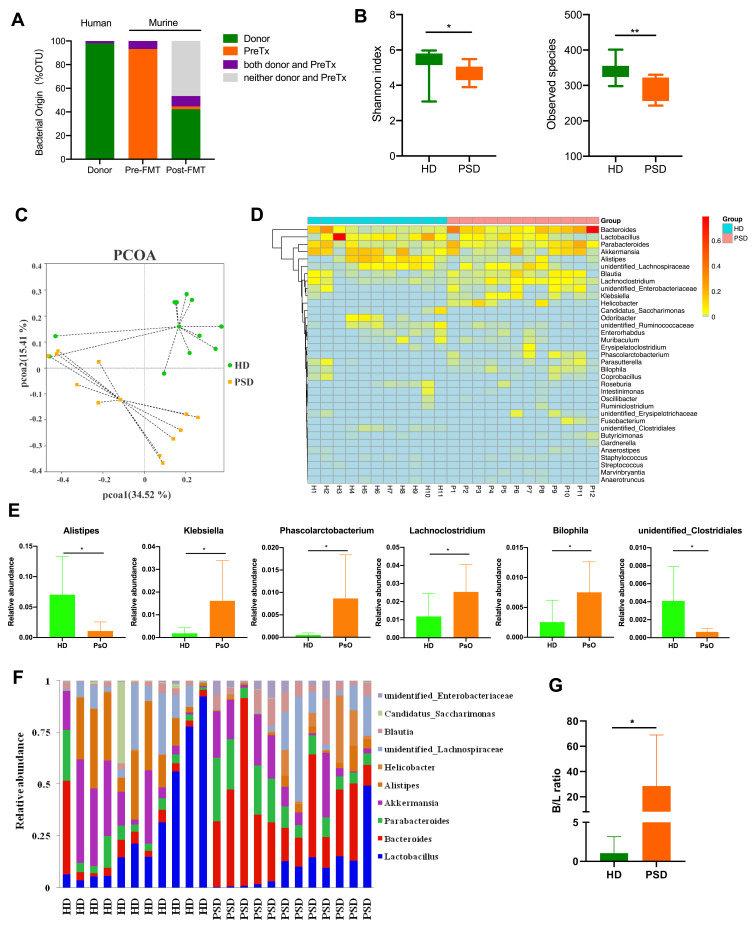
Figure 4.
Characterization of the gut microbiota profile in mice after FMT. (A) Taxonomic classification of bacterial 16S sequence detected in human donor stools and FMT recipient mice stools by origin. (B) Comparison of alpha-diversity indices (Shannon Index and observed species) between HD (n=11) and PSD groups (n=12). Anova & Student t-test statistical analyses of means ± SD: *p < 0.05, **p < 0.01. (C) Principal coordinate analysis based on Bray–Curtis distances of fecal gut microbiome derived from HD (green dots) and PSD (Orange dots) treatment mice. (D) Heatmap cluster of the community composition at the genus level of each mice of HD and PSD. (E) Statistical analysis (unpaired t-test) of the community composition at the genus level between HD and PSD mice. Anova & Student t-test statistical analyses of means ± SD: *p < 0.05. (F) Relative abundance of the gut microbiota taxa identified at genus level. (G) The Bacteroides/Lactobacillus ratio between HD and PSD. Anova & Student t-test statistical analyses of means ± SD: *p < 0.05.

