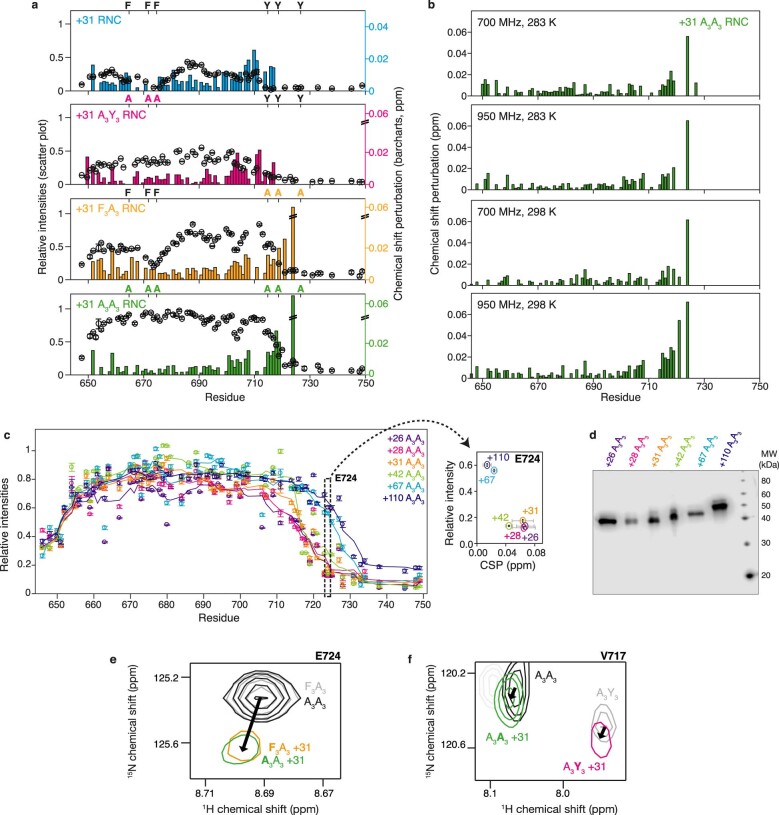
Extended Data Fig. 5. CSPs of FLN5 RNCs against isolated FLN5 variants, and comparison of chemical shift perturbations in the C-terminal region of FLN5 RNCs between aromatic cluster variants.
(a) Relative intensities (LH axis) of FLN5+31, FLN5+31 A3Y3, FLN5+31 F3A3 and FLN5+31 A3A3 RNCs (283 K) and chemical shift perturbations (RH axis, )), relative to their corresponding isolated, unfolded FLN5 variants. (b) Chemical shift perturbations of FLN5+31 A3A3 RNC relative to isolated FLN5 A3A3, at fields and temperatures as indicated. (c) Relative intensities of FLN5+26, 28, 31, 42, 67, 110 A3A3 RNCs relative to isolated FLN5 A3A3 (283 K, 950 MHz). inset: Intensities and combined amide chemical shift perturbations () of the E724 amide resonance observed relative to isolated FLN5 A3A3 in 1H,15N SOFAST-HMQC spectra of FLN5 A3A3 RNCs, with varying linker lengths as indicated. (d) Anti-His tag western blot of FLN5+26, 28, 31, 42, 67, 110 A3A3 RNCs purified for NMR studies, in their tRNA-bound form. (e) Comparison of C-terminal chemical shift perturbations between A3A3 and F3A3 variants. The difference in perturbations between A3A3 and F3A3 variants was 0.009 ± 0.050 ppm (15N) and 0.002 ± 0.006 ppm (1H). (f) Comparison of C-terminal chemical shift perturbations between A3A3 and A3Y3 variants. Due to chemical shift perturbations between the A3A3 and A3Y3 variants, and the reduced intensity of C-terminal residues in the A3Y3 variant (Fig. 2b), E724 cannot be resolved in the A3Y3 spectrum and residue V717 is analyzed instead. The difference in perturbations between A3A3 and A3Y3 variants was 0.060 ± 0.044 ppm (15N) and 0.001 ± 0.006 ppm (1H). Based on these negligible differences, mutations in the F3 and Y3 clusters do not seem to affect the CSP which report on the ribosome interaction of the C-terminal segment (residues N728 to C747).

