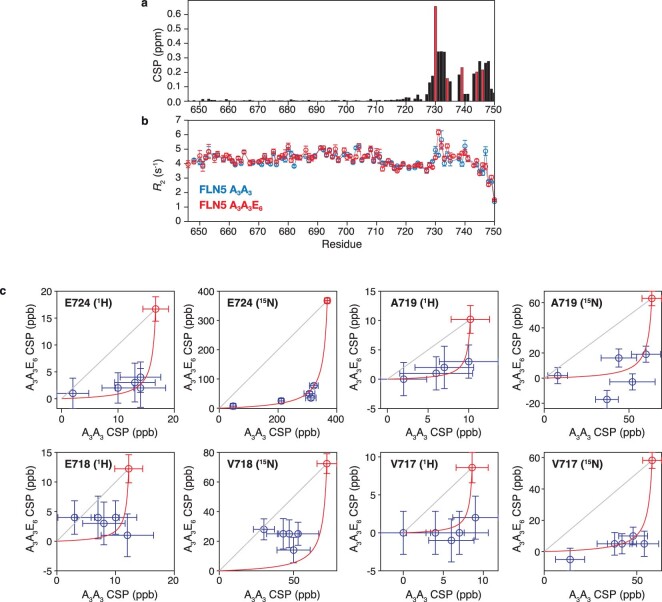
Extended Data Fig. 8. Global analysis of FLN5 A3A3 and A3A3E6 chemical shift perturbations.
(a) Chemical shift perturbations of FLN5 A3A3 vs. FLN5 A3A3E6 ()). E6 mutation sides are indicated using red bar charts. (b) T2 relaxation measurements of isolated FLN5 A3A3 and FLN5 A3A3E6. (c) Correlation plots of 1H and 15N chemical shift perturbations in +26, +28, +31, +42 and +110 A3A3/A3A3E6 RNCs for residues as indicated (283 K, 950 MHz). A global fit of is shown (red line) and red markers indicate the fitted values of Δδmax (χ2 = 70.17, dof = 66, χ2/ν = 1.06).

