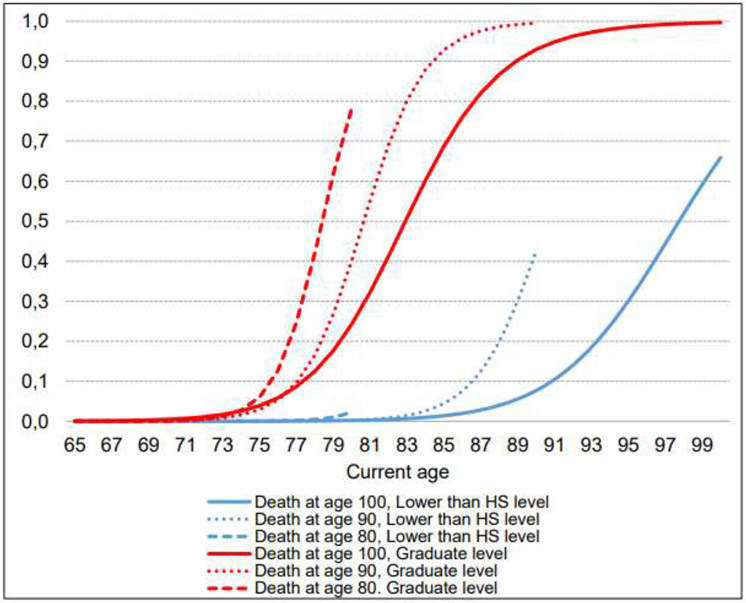
Figure 3: Probability of having a living will, by current age and age at death for different educational levels.

Notes: HS denotes “high-school”. The graph depicts an average sample population that has different levels of educational attainment for different ages at death.
