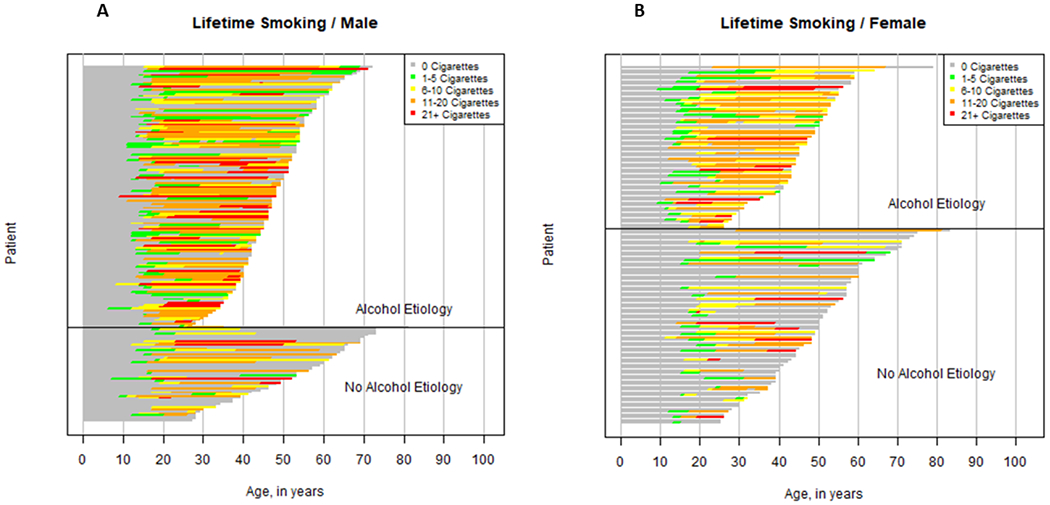
Figure 1. Component bar diagram of individual smoking trajectory in chronic pancreatitis patients by alcohol etiology, Male (A) and Female (B).

Each bar represents smoking trajectory in each participant with the length of the colored bars indicating the duration of smoking at that colored intensity. Gray bars indicate periods of non-smoking, green bars indicate periods of smoking ≤5 cigarettes/day, yellow bars indicate smoking 6-10 cigarettes/day, orange bars indicate smoking 11-20 cigarettes/day and red bars indicate smoking more than 20 cigarettes/day. Bars end at age of CP diagnosis.
