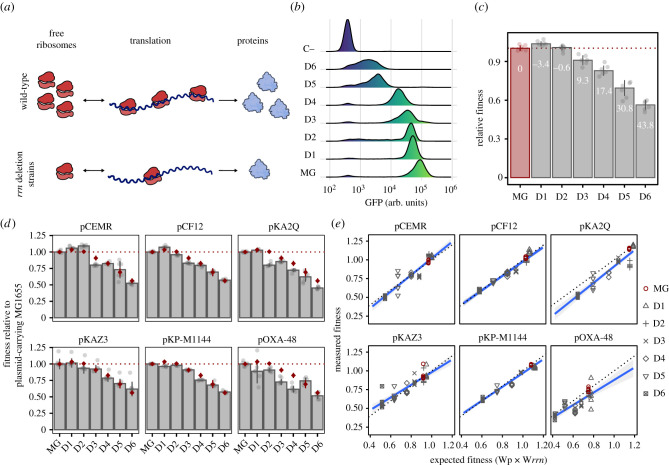
Figure 3.
Reducing ribosomal availability does not increase plasmid costs. (a) Reduced ribosomal availability depletes the pool of available ribosomes, consequently reducing translation rate. This is illustrated by comparing translation in wild-type cells (above) and rrn deletion strains (below). (b) After 2 h of induction with 0.1% l-arabinose, strains with reduced ribosomal availability show lower fluorescence levels (in arbitrary units; arb. units) than MG1655 (MG) as measured by flow cytometry, indicating a reduced translation capability. For reference, an uninduced MG1655 control (C−) is included. (c) Fitness of strains carrying rrn deletions relative to MG1655. Each bar corresponds to the median value of six replicates, with each point representing an independent biological replicate. Error bars depict standard deviation. Numbers within each bar show the cost of each deletion (% reduction in relative fitness relative to plasmid-free MG1655). (d) Fitness of the plasmid–rrn deletion strain combinations relative to the fitness of plasmid-carrying MG1655. The height of the bar represents the median fitness of each plasmid–rrn deletion strain combination relative to MG1655 carrying each of the plasmids. Red diamonds represent median fitness values of rrn deletion strains relative to MG1655 (as in figure 3c). Therefore, bars below their respective diamond indicate greater plasmid costs (i.e. lower fitness), whereas those above the diamond show lower plasmid-associated costs than those found in MG1655. Error bars represent standard deviation and each point represents an independent biological replicate (n = 6). (e) Relationship between expected fitness calculated as the product of the fitness effects of each plasmid (Wp) and mutation (Wrrn) separately and the fitness measured for each plasmid–mutant combination in competition experiments. Data points above the grey dotted lines indicate positive epistasis, whereas those below show negative epistasis (i.e. increased plasmid-associated costs). Genotypes are depicted using different symbols (see legend). The blue lines show linear regression of the data with 95% confidence intervals (grey shading).

