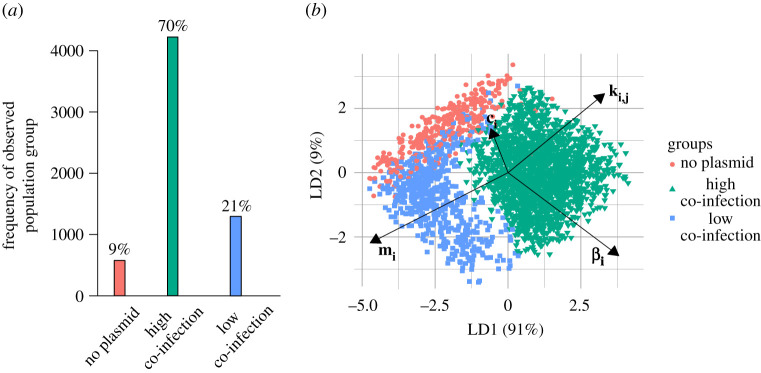
Figure 2.
Parameter space exploration using linear discriminant analysis (LDA). (a) Probability of each class over all simulation outcomes. Frequencies of each class at the end of 500 time steps - ‘no plasmid’ (red), ‘high co-infection’ (green) or ‘low co-infection’ (blue)—are given for 6100 parameter sets randomly sampled over [0, 0.5] for mi and [0, 1] for ki,j (= 2ki,AB), βi and ci. (b) LDA using the three classes shown in (a) (same colour scheme). Arrows show the magnitude and direction of the parameters varied (e.g. the shorter arrow of ci indicates lower significance of this parameter in class separation, whereas mi and ki,j (ki,AB) are most important in separating high from low co-infection areas).

