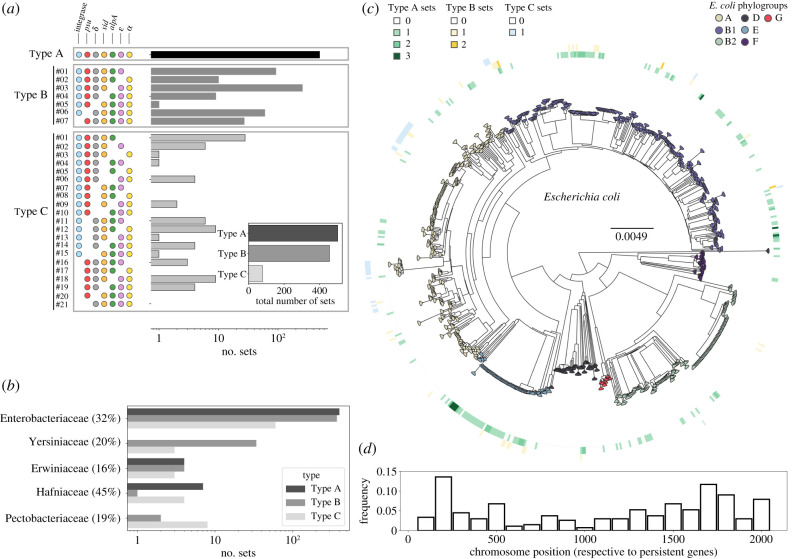
Figure 1.
The abundance, genetic composition and bacterial hosts of P4-like elements. (a) Log-scale abundance of the variants, defined by the combinations of core components (circles to the left of the distributions). The inset shows the total abundance per type, considering all variants. (b) Distribution of the different sets in bacterial families. The percentages following the families indicate the fraction of bacterial genomes of that family that encode P4-like satellites. (c) Distribution of P4-like sets in the E. coli species tree. The tree was built using maximum likelihood, using the alignment of the core genome (2107 genes) from 657 E. coli genomes obtained using PanACoTA [23] and FastTree with default parameters [24]. The presence and abundance of sets of Type A (green), B (yellow) or C (blue) are shown in the inner, middle and outer circle, respectively, with genomes that encode for more than one set of either type shown as a stronger shade of their respective colour. (d) Position of the P4-like element along the chromosome of E. coli. The core genes of the species were ordered and numbered in function of the position of the gene in the chromosome of strain MG1655 from 1 to 2107. Positions between core genes define genome intervals. The position indicates the interval where the P4-like element was identified. Hence, an element integrating the same region across genomes would have the exact same position.

