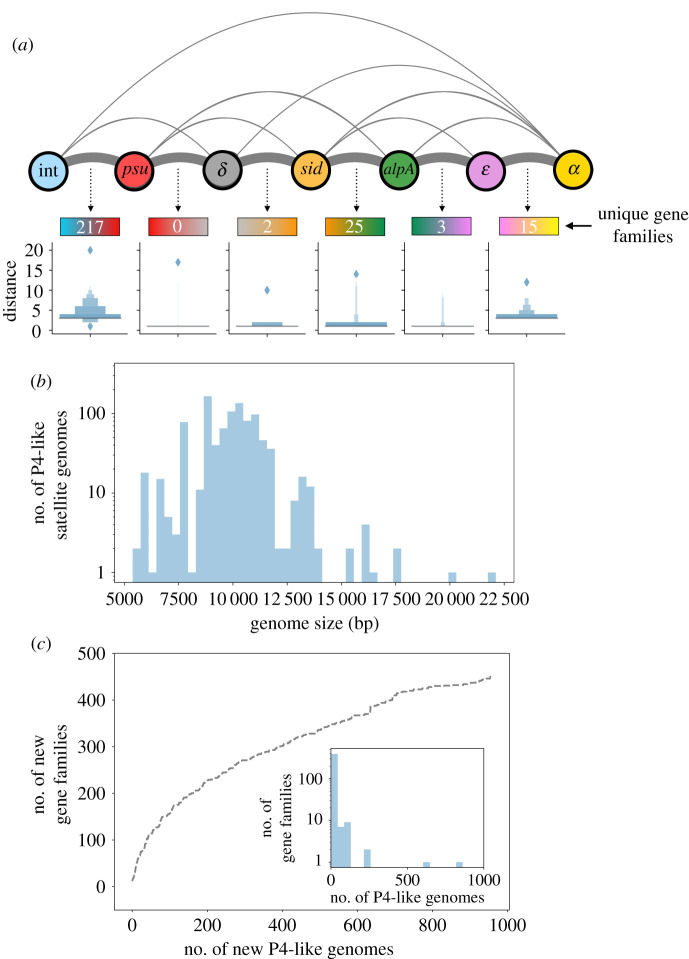
Figure 2.
The genomes and pangenome of P4-like satellites. (a) Genetic organization of the P4-like elements. Nodes indicate core genes and edges link the nodes when the two core genes are consecutive in the genome organization of core genes. The thickness of the edges between nodes is proportional to the frequency of adjacency of pairs of the corresponding components. The number of unique gene families detected between each two genes are indicated below the space between each respective circle. These families were calculated considering only Type A elements that have the most common organizational variants. The box plots show the distribution of the number of open reading frames between consecutive components. The outliers of these distributions represent the rare organizational variants where the most frequent pairs of components are further than 10 genes apart. (b) Histogram of the genome size of P4-like elements. (c) Rarefaction curve of the gene families of P4-like genomes, excluding those of core components. New gene families were sequentially added from randomly ordered P4-like genomes. The inset shows the frequency of the gene families.

