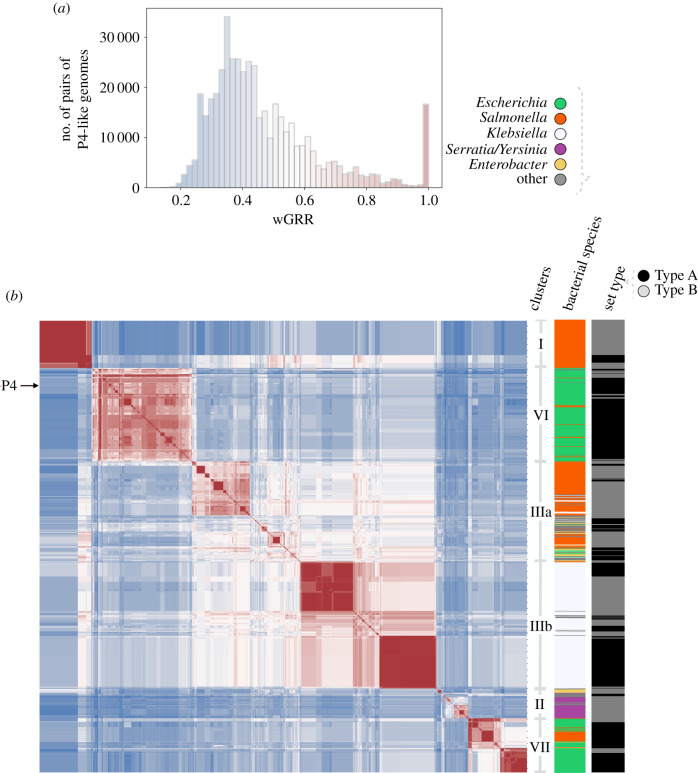
Figure 3.
Comparison of gene repertoires of P4-like satellites. (a) Histogram of wGRR for all pairwise comparisons between the 958 P4-like genomes (of Types A and B). (b) Heatmap of the matrix of the wGRR values ordered using hierarchical clustering. The colours follow the same code as in (a). The columns to the right of the heatmap indicate the bacterial species where the P4-like genome was detected and the Type (A or B) of the P4-like genome. The position of the P4 genome in the matrix is indicated on the left side. The clusters were determined by using ‘maxclust’ and a threshold of seven flat clusters as parameters. They are shown as the most common cluster representatives in each main region of the heatmap (the complete detailed list of cluster assignments is given as electronic supplementary material, file S4).

