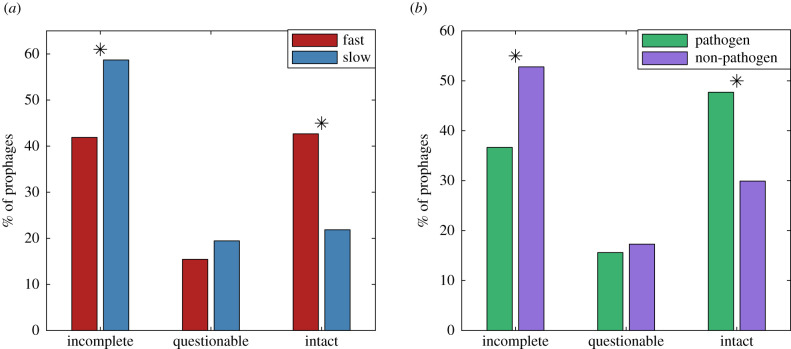
Figure 1.
Percentage of prophages in each PHASTER classification [34] for fast- and slow-growing hosts (a) and pathogenic and non-pathogenic hosts (b). In (a), significance was assessed by drawing 10 000 bootstrapped samples of the same size as the fast and slow datasets from a pooled dataset (fast/slow); in (b), the pooled dataset contained the pathogenic and non-pathogenic data. Stars indicate significant differences between the two host types at the 5% significance level, two-sided test, Bonferroni correction for three comparisons in each case.

