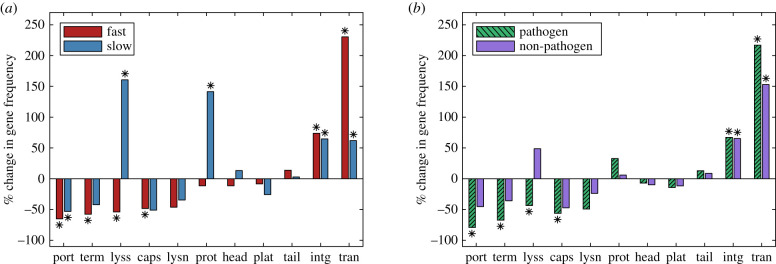
Figure 5.
The per cent change in gene frequency for prophages in fast- and slow-growing hosts (a), and pathogens and non-pathogens (b); the gene frequency in incomplete prophages is compared to intact prophages in the hosts of the same class. Frequencies that were significantly lower or higher than expected by chance with a two-sided 5% significance threshold are indicated by stars (Bonferroni-corrected for 11 simultaneous comparisons). Thus stars indicate gene classes that are preferentially lost or enriched in cryptic prophages. Gene classes are ordered from left to right by degree of enrichment in fast-growing hosts; phage gene keywords in the annotation search were: portal, terminase, lysis, capsid, lysin, protease, head, plate, tail, integrase and transposase. (Online version in colour.)

