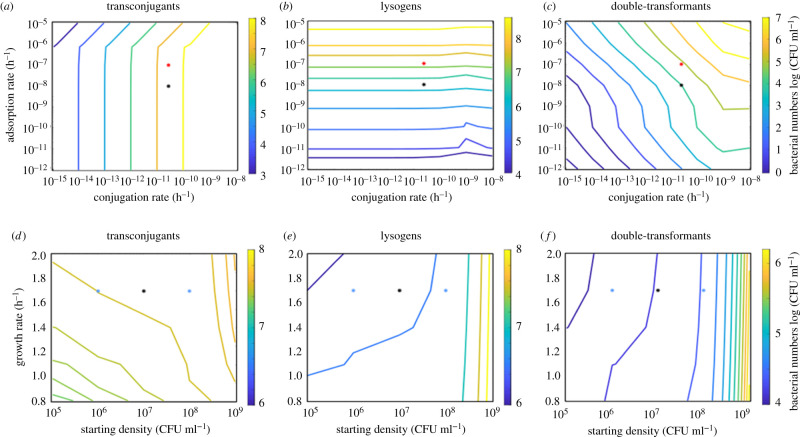
Figure 2.
Variation of modelling parameters using the independent-donor model. Contour plots give bacterial cell numbers (log (CFU ml−1)) of (a,d) transconjugants, (b,e) new lysogens and (c,f) double-transformants in response to variation in adsorption and conjugation rate (top row), or growth rate and starting bacterial density (bottom row) at the end of 24 h simulations. (d–f) were simulated using parameters from LB environments. Asterisks show the parameter values used in the simulations for figure 1f in LB (black) or SM (red), or for figure 3e,f (blue).

