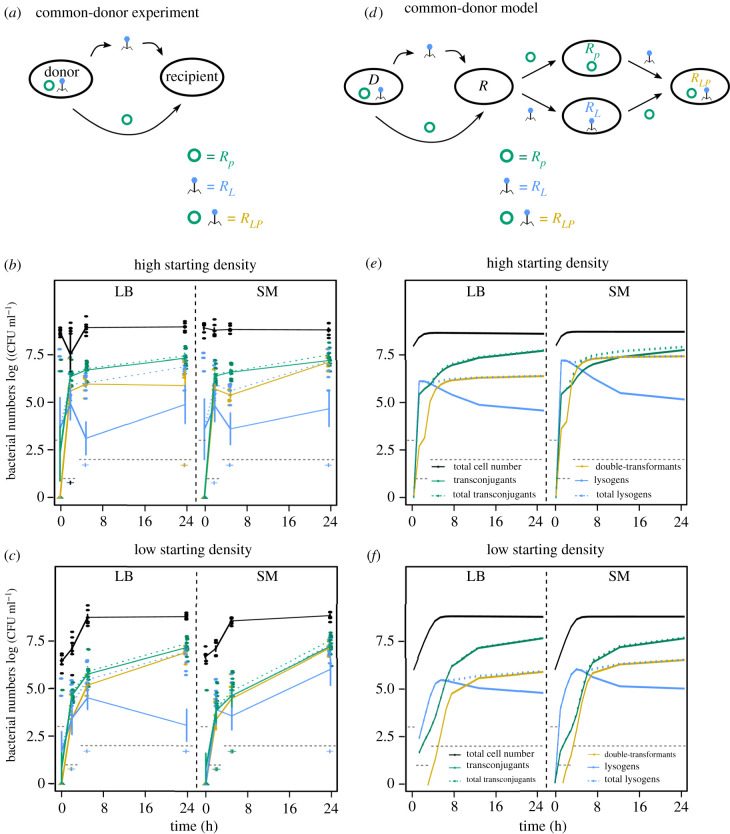
Figure 3.
Common-donor experiment. (a) A common donor carrying the plasmid and the phage (DLP) was mixed with recipient cells. Transconjugants (green) are recipients, which acquired the plasmid (RP), lysogens (blue) are recipients, which acquired the prophage (RL), and double-transformants (yellow) are recipients, which acquired the plasmid and the phage (RLP). (b,c) Total cell number (black), as well as newly formed lysogens (blue), transconjugants (green), and double-transformants (yellow) measured as colony forming units log (CFU ml−1) over time in LB (left panel) or SM (right panel) starting with (b) high or (c) low bacterial densities (shown are single data points as well as mean ± s.e., n = 6). For comparison with figure 1b total transconjugants (RP + RLP) and total newly formed lysogens (RL + RLP) are shown in dashed green or blue lines but might be hidden by the respective solid lines. Grey dashed lines indicate the empirical detection limit at a given time point (Methods). (d) Schematic of reactions for the common-donor model. (e,f) Predictions of 24 h model simulations for phage and plasmid spread with a common donor in LB (left panel) or SM (right panel) starting with (e) high or (f) low bacterial densities using highly preferential infection parameters of MGE-carriers (colours and line types as described in b,c).

