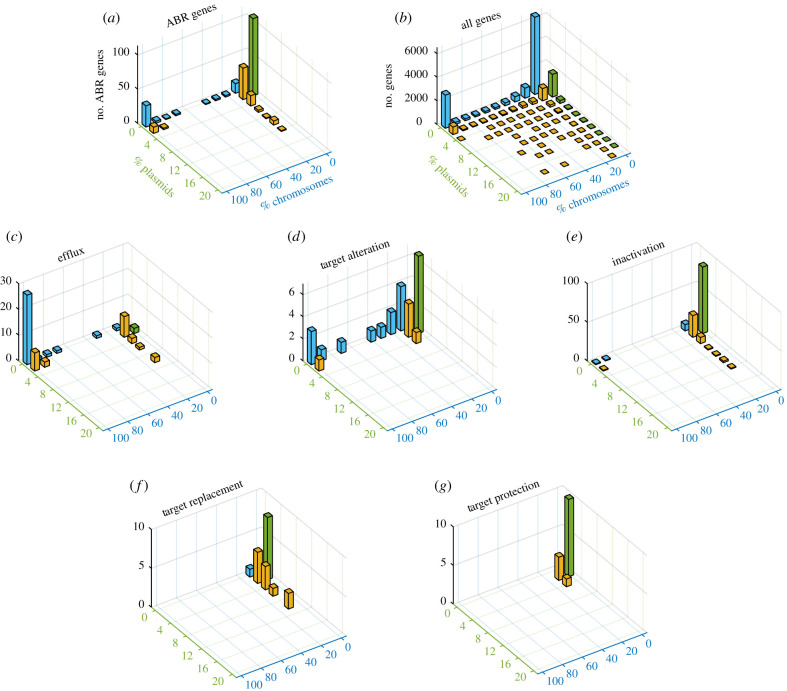
Figure 1.
A comparison of gene prevalence in plasmids and chromosomes in Escherichia isolates. Plots in the figure present three-dimensional histograms of gene occurrence in plasmids (green axis) and chromosomes (blue axis). The height of bars in the histogram corresponds to the number of genes that are encoded in the same frequency group on chromosomes and plasmids. The bar coordinates correspond to the proportion of replicons (plasmids or chromosomes) where the genes occur. Note that no gene occurs in more than 20% of the plasmids; genes occurring in 100% of the chromosomes correspond to core gene families. Genes occurring only on chromosomes are shown with blue bars. Genes occurring only on plasmids are shown with green bars. Yellow bars correspond to genes that occur in both plasmids and chromosomes. (a) ABR genes in the examined isolates (data supplied in electronic supplementary material, table S3). (b) Gene occurrence of all Escherichia gene families. (c–g) ABR genes according to their classification into ABR mechanism (as in CARD [28]).

