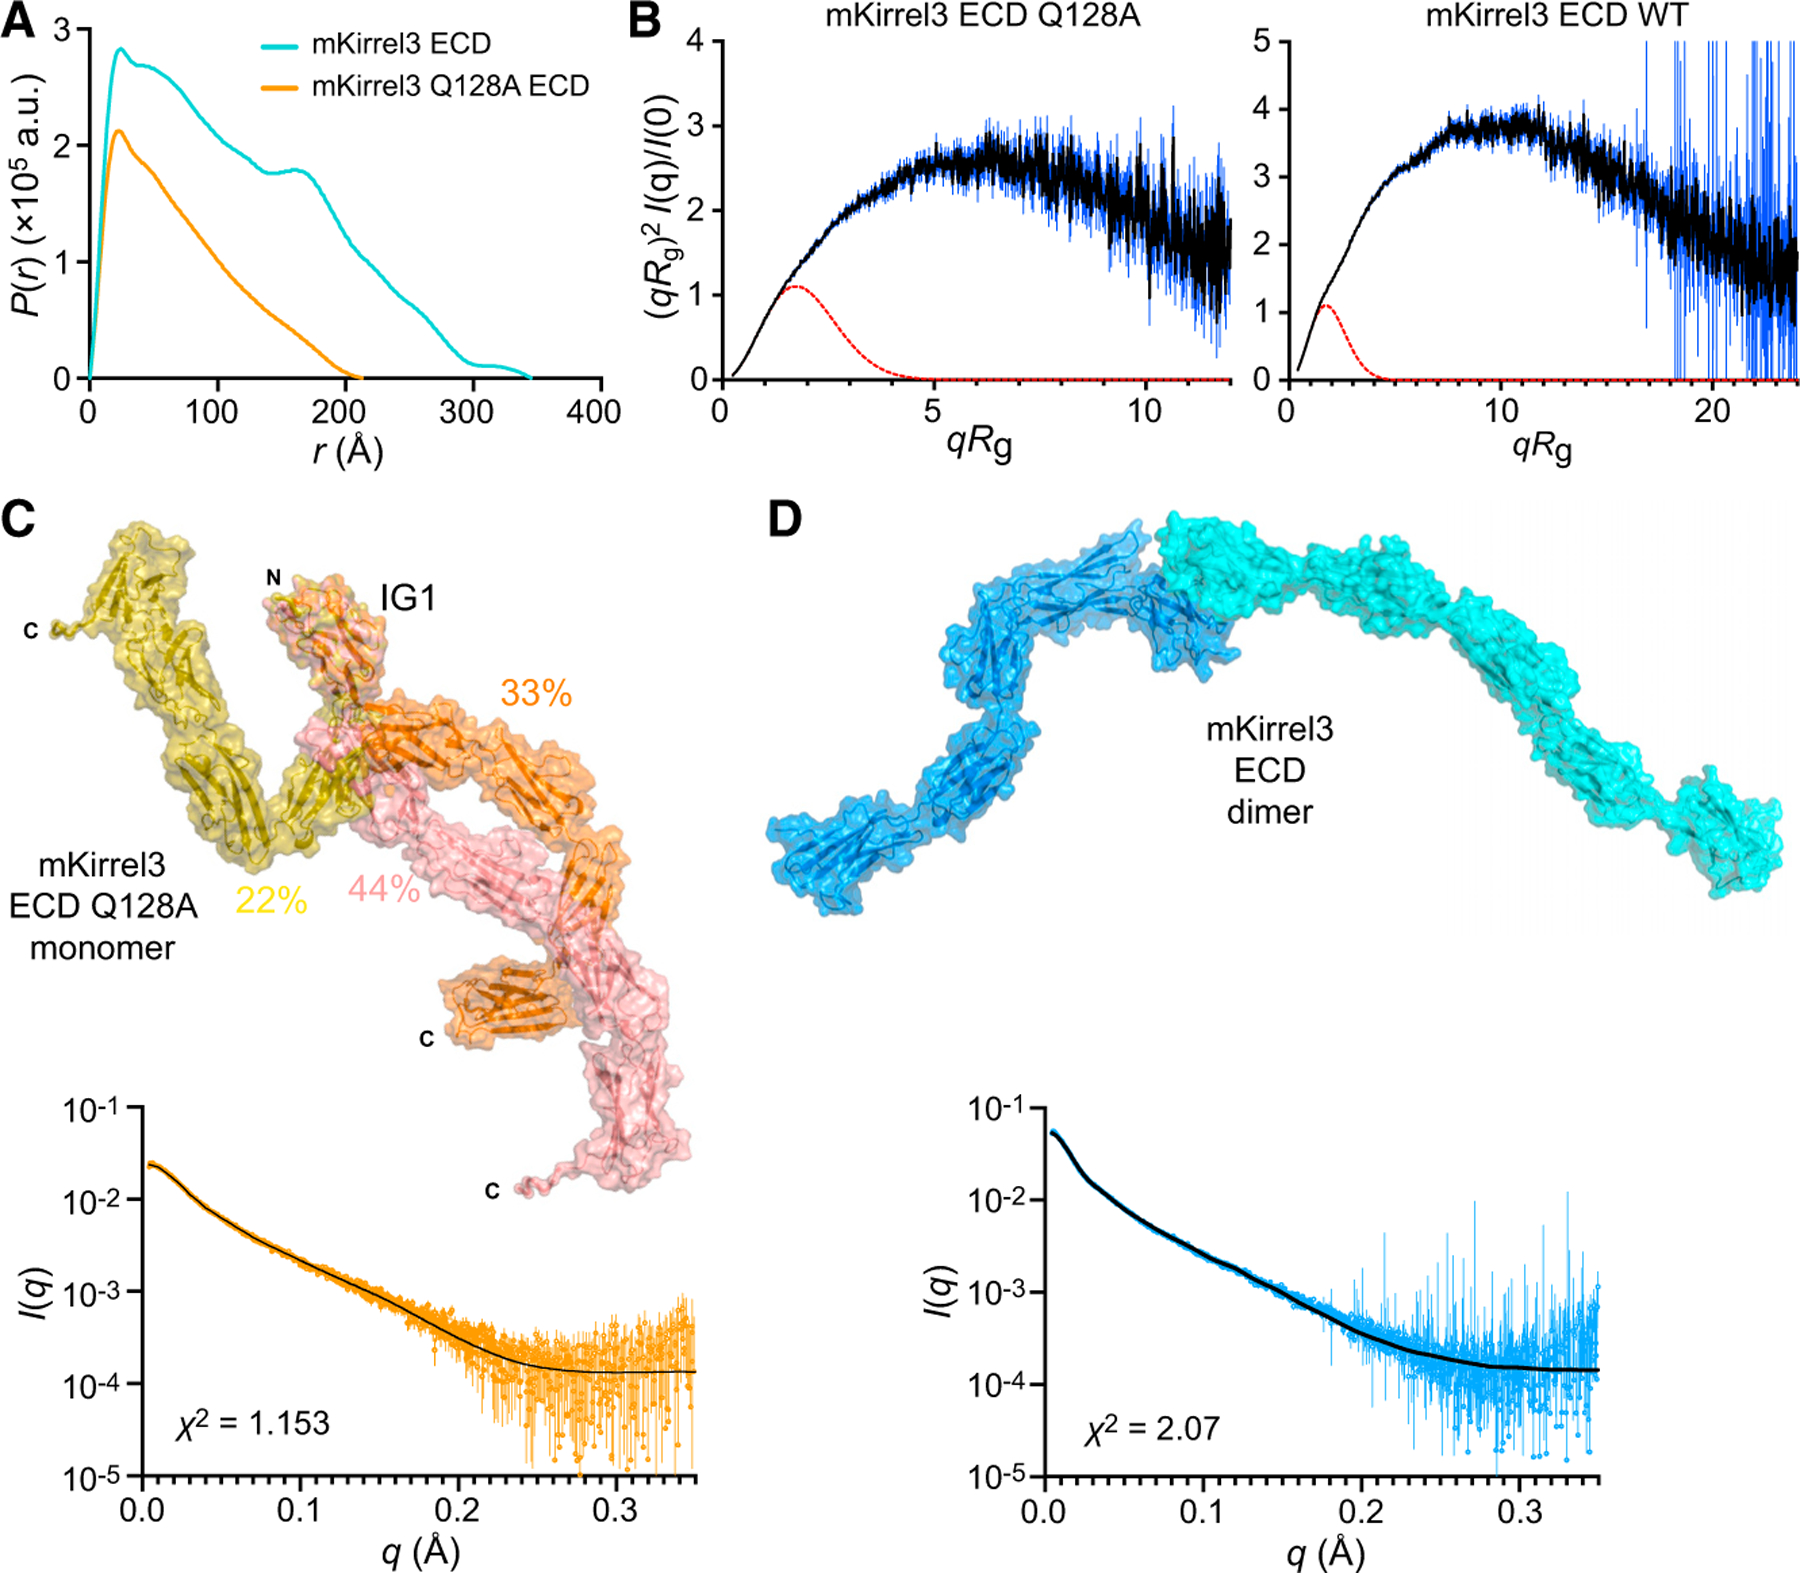
Figure 5. SAXS analysis of Kirrel ectodomains.

(A) Pair distance distributions, P(r), for mKirrel3 ectodomains, wild type, and Q128A. Wild-type Kirrel3 is a longer molecule than Kirrel3 Q128A because it has a larger Dmax (35 nm versus 21 nm).
(B) Dimensionless Kratky plots for mKirrel3 ectodomains; blue vertical lines are measured errors. Dashed red lines show predicted plots for rigid, globular molecules with the same Rg.
(C) Ensemble model fitting of SAXS data for mKirrel3 Q128A ectodomain using EOM. The three-model ensemble with contributions are indicated as percentages next to the models. The scattering profile predicted from the ensemble model (black) closely matches observed scattering data (orange; measurement errors are indicated by vertical bars).
(D) SASREF model of mKirrel3 wild-type ectodomain dimer and its predicted scattering (black) overlayed on observed SAXS data (blue; measurement errors are indicated by vertical bars). See also Figure S5.
