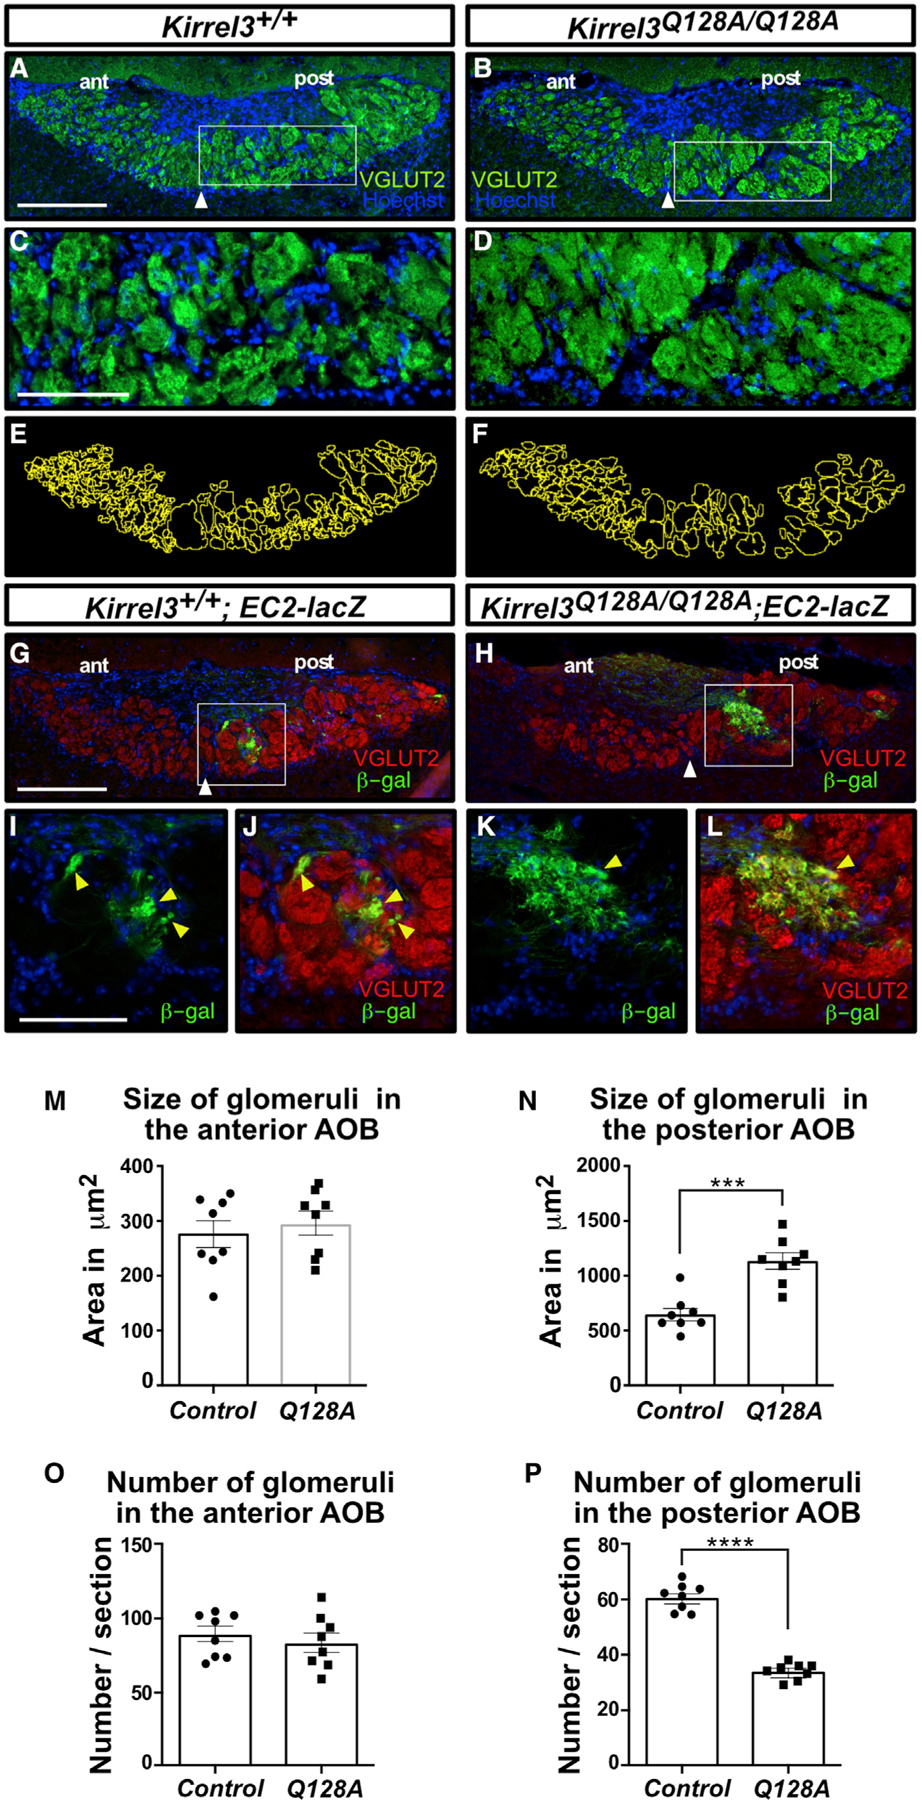
Figure 7. Glomerulus structure is altered in the AOB of Kirrel3Q128A/Q128A mice.

(A–F) Parasagittal sections of the AOB from adult Kirrel3+/+ (A and C) and Kirrel3Q128A/Q128A (B and D) mice labeled with a VGLUT2 antibody and Hoechst (A–D). Higher magnification of outlined regions in (A) and (B) are shown in (C) and (D), respectively. Glomeruli in the posterior region of the AOB in Kirrel3Q128A/Q128A mice appear significantly larger and less numerous than those in Kirrel3+/+ mice (E and F). White arrowheads denote the boundary between the anterior (ant) and posterior (post) regions of the AOB; n > 8 mice for each genotype.
(G–L) Parasagittal sections of the AOB from adult Kirrel3+/+; EC2-lacZ (G) and Kirrel3Q128A/Q128A; EC2-lacZ (H) mice labeled with a VGLUT2 (red) and b-galactosidase (green) antibodies and Hoechst (G–L). Higher magnification of outlined regions in (G) and (H) are shown in (I) and (J) and (D) and (L), respectively. EC2-positive axons coalesce into small and well-defined glomeruli in Kirrel3+/+; EC2-lacZ mice (yellow arrowheads; I and J) but innervate larger heterogenous glomeruli in Kirrel3Q128A/Q128A mice (yellow arrowheads in K and L); n = 2 mice for each genotype.
(M–P) Quantification of the size and number of glomeruli in the anterior (G and I) and posterior regions (H and J) of the AOB in adult control and Kirrel3Q128A/Q128A mice. A representation of the glomerulus outlining approach used for quantification using sections in (A) and (B) as examples are shown in (E) and (F), respectively. A significant increase in the size of glomeruli in the posterior (control: 644.0 ± 56.2 μm2; Kirrel3Q128A/Q128A: 1,134.1 ± 74.5 μm2), but not anterior (control: 284.0 ± 19.6 μm2; Kirrel3Q128A/Q128A: 295.6 ± 22.1 μm2), region of the AOB is observed in the Kirrel3Q128A/Q128A mice (G and H). There is also a decrease in glomerulus numbers in the posterior (control: 61.15 ± 1.75; Kirrel3Q128A/Q128A: 34.27 ± 1.02), but not anterior (control: 87.21 ± 4.92; Kirrel3Q128A/Q128A: 84.22 ± 6.33), region of the AOB in Kirrel3Q128A/Q128A mice (J). Data were analyzed using unpaired t test; n = 8 mice for each genotype. ****p value < 0.0001 (glomerular counts); ***p value < 0.001 (glomerular size); error bars: ±standard error of the mean (SEM); scale bars, 250 μm in (A) and (B) and 100 μm in (C) and (D).
