Figure 1.
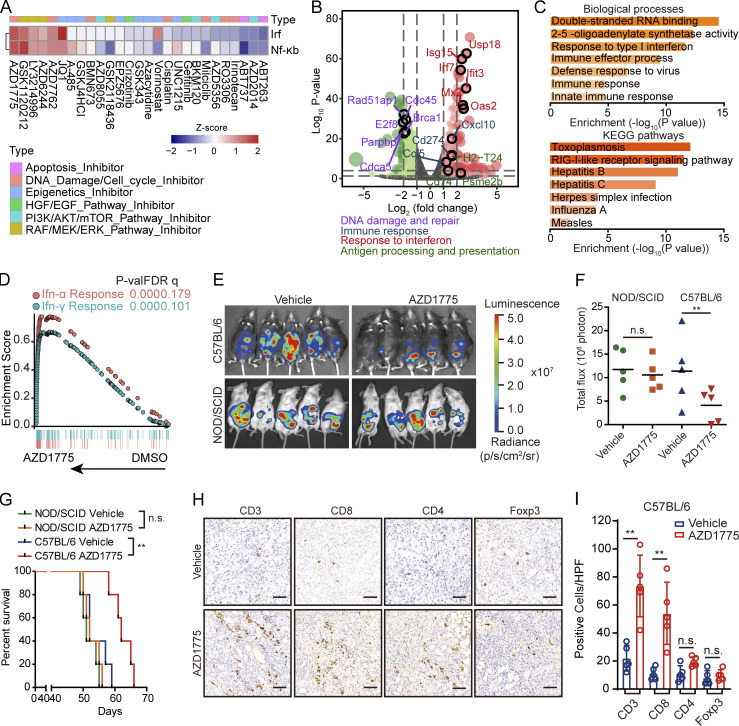
AZD1775 activates tumor immune response by IFN pathway and recruiting T cell infiltration. (A) Z-score of relative Irf and NF-κB activity in HCT116-Dual cells after treatment with various agents as indicated (treatment/DMSO) for 48 h. Data represent three independent experiments. (B–D) RNA-seq data analysis of ID8 cells treated with AZD1775 or DMSO (three repeats). (B) Volcano plot of differentially expressed genes. (C) GO and KEGG terms enriched after AZD1775 treatment. (D) GSEA of HALLMARK-IFN pathways induced by AZD1775. (E–I) In vivo experiment of ID8 treated with AZD1775 (n = 5; two independent experiments). Representative images (E) and relative total flux of luminescence (F) of ID8 tumors in C57BL/6 and NOD/SCID mice treated with vehicle or AZD1775. (G) Kaplan–Meier survival curves of C57BL/6 and NOD/SCID mice with ID8 tumors treated as indicated. (H and I) Representative images and quantification of immunohistochemistry analyses of CD3+, CD8+, CD4+, and Foxp3+ T reg cells in ID8 tumors after treatments in C57BL/6 mice. HPF, high power field; P-val, P value; FDR q, False Discovery Rate p-value. Scale bar, 50 µm. **, P < 0.01, n.s., not significant as determined by unpaired t test (F and I) and log-rank test (G). p, photons; sr, steradian.

