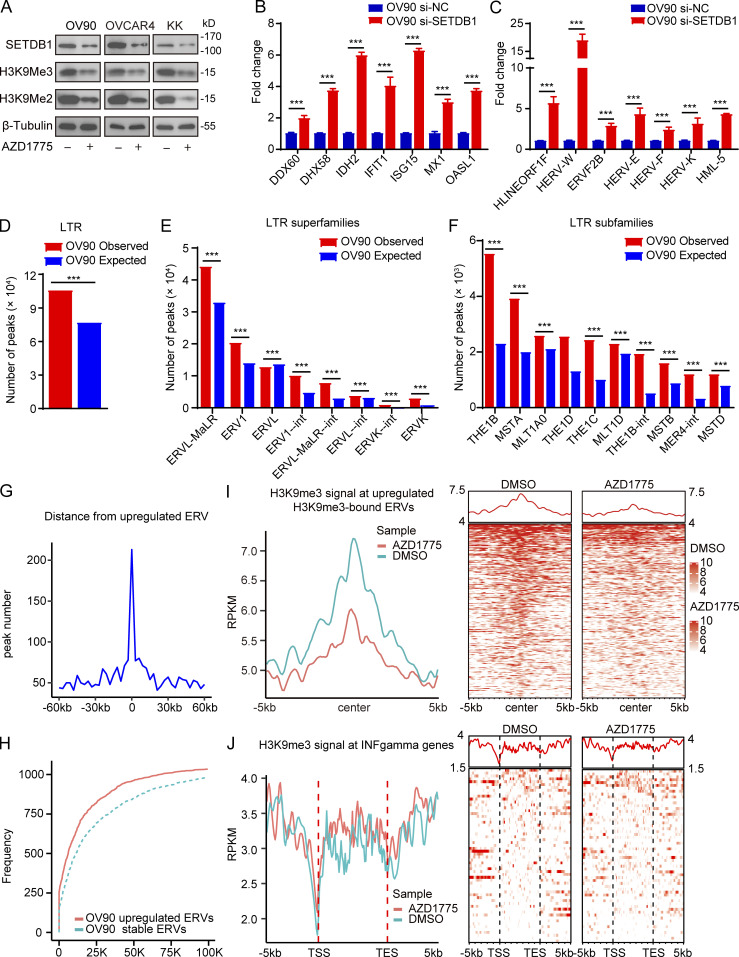
Figure 3.
Decreased H3K9me3 after WEE1 inhibition contributes to dsRNA stress and promotes IFN activation. (A) Western blot of indicated proteins in OV90, OVCAR4, and KK cells treated with AZD1775 for 72 h. Data represent three independent experiments. (B and C) Quantification of ISGs (B) and ERVs (C) by qPCR in OV90 cells treated as indicated for 48 h (three independent experiments). (D–J) CHIP-seq of H3K9me3 analysis in OV90 cells treated with AZD1775 or DMSO (n = 3). (D–F) The observed and expected (10,000 bootstraps) H3K9me3 peaks located at LTR (D), LTR superfamilies (E), and LTR subfamilies (F) in OV90 cells. (G) Line plot showing the distance distribution from all up-regulated ERVs to H3K9me3 peaks in 60-kb flanking windows (3 kb per bin) in OV90 cells. (H) Cumulative frequencies of distance from up-regulated ERVs to the closest peaks. Dotted line represents the cumulative frequencies of distance from a random selection of stable ERVs to their closest peaks in OV90 cells. (I) Line plot of average H3K9me3 signal at up-regulated ERVs in the gene body plus 5 kb upstream of the transcription start site (TSS) and downstream of the transcription end site (TES) and heatmap showing the H3K9me3 signal for each up-regulated ERV in the gene body plus 5 kb upstream of the TSS and 5 kb downstream of TES in OV90 cells. (J) Density distribution (left) and heatmap (right) of H3K9me3 ChIP-seq signal across the up-regulated ISGs transcription start site (TSS, −5/ + 5 kb). ***, P < 0.001, as determined by unpaired t tests (B and C) and one-sided binomial test (D–F).

