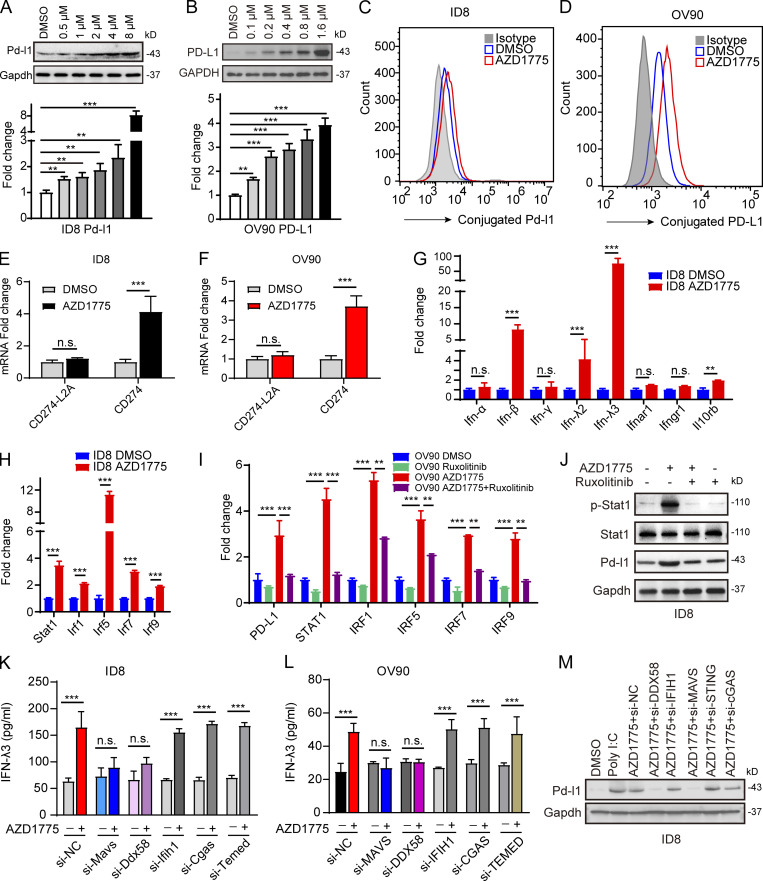
Figure 5.
AZD1775 induces PD-L1 expression through IFN signaling. (A and B) Western blots and qPCR of PD-L1 levels in ID8 and OV90 cells treated with a concentration gradient of AZD1775 for 48 h. Data represent three independent experiments. (C and D) Cytofluorimetric histograms of PD-L1 obtained after AZD1775 for 48 h in ID8 and OV90 (three independent experiments). (E and F) Quantification of two CD274 variants by qPCR in ID8 cells and OV90 treated with AZD1775 or DMSO for 48 h. CD274 encoded the canonical full-length PD-L1 while CD274-L2A is the predominant solute PD-L1–encoding variant (three independent experiments). (G and H) Quantification of IFN/IFNR-related genes (G) and IFN-related transcription factors (H) by qPCR in ID8 cells treated with AZD1775 or DMSO for 48 h (three independent experiments). (I) Quantification of selected genes by qPCR in OV90 cells treated with AZD1775, JAK inhibitor (ruxolitinib, 5 µM), or combination for 48 h (three independent experiments). (J) Western blots for STAT1 activation and PD-L1 expression in ID8 cells treated with AZD1775, ruxolitinib, or combination. Data represent three independent experiments. (K and L) ELISA detection of IFN-λ3 levels treated as indicated in ID8 and OV90 cells (three independent experiments). (M) Western blots for PD-L1 treated as indicated. Data represent three independent experiments. The qPCR data were normalized to β-actin. Data across panels represent mean ± SEM. **, P < 0.01; ***, P < 0.001, n.s., not significant as determined by unpaired t test (E–H, K, and L), and ANOVA with Bonferroni post hoc test (A, B, and I).

