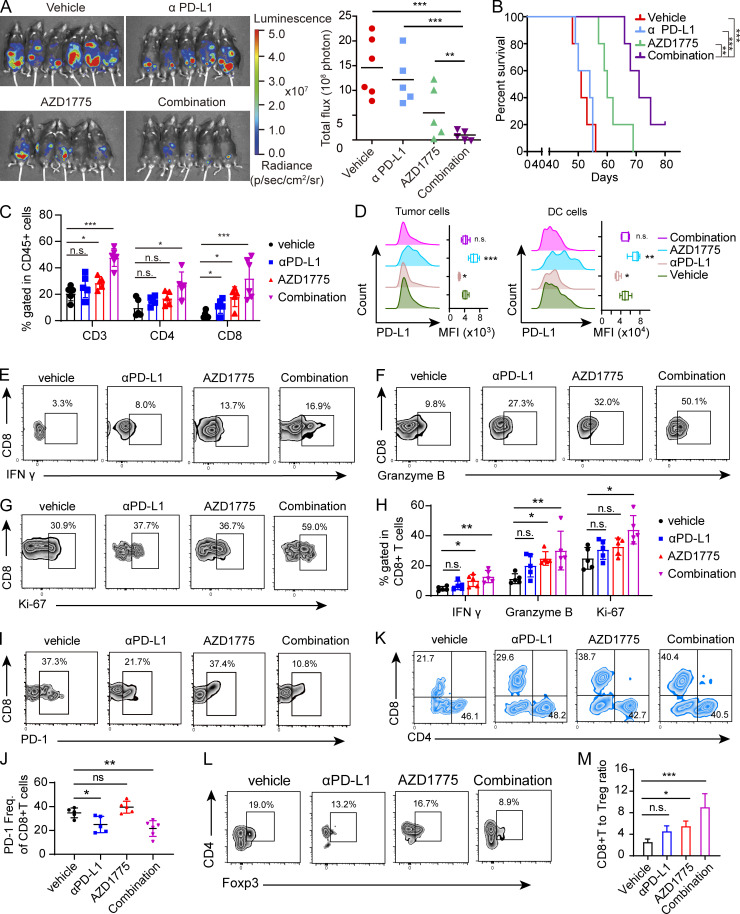
Figure 6.
AZD1775 combined with ICB represses tumor growth in a CD8+ T cell–dependent manner. (A) Representative images and quantification of total flux of luminescence of ID8 tumors in C57BL/6 mice after treatment with vehicle, AZD1775, αPD-L1, or combination of AZD1775 and αPD-L1 (n = 5 or 6 each, two independent experiments). (B) Kaplan–Meier survival curves of C57BL/6 mice with ID8 tumors treated as described in A (n = 5 or 6 each, two independent experiments). (C) The percentage of CD3+, CD4+, and CD8+ T cells in CD45+ cells in tumor tissues from different treated groups were quantified via flow cytometry (n = 5 or 6 each). (D) PD-L1 expression determined by flow cytometry on tumor cells (left) and DC cells (right) in tumors treated as indicated (n = 5 or 6 each). (E–H) Representative flow cytometry plots and quantification of IFN-γ, granzyme B, and Ki-67–positive T cells (gated on CD8+ cells) in ID8 tumors treated as indicated (n = 5 or 6 each). (I and J) Representative flow cytometry plots (I) and quantification (J) of PD-1–positive T cells (gated on CD8+ cells) in ID8 tumors treated as indicated (n = 5 or 6 each). (K) Representative flow cytometry plots (n = 5 or 6 each) of CD4+ and CD8+ T cells (gated on CD3+ T cells) in ID8 tumors treated as indicated. (L) Representative flow cytometry plots of Foxp3+ T reg cells (gated on CD4+ cells) in ID8 tumors treated as indicated (n = 5 or 6 each). (M) The ratio of CD8+T cells to T reg cells is shown (n = 5 or 6 each). The data in C–M are from one representative experiment of two performed with similar results. *, P < 0.05; **, P < 0.01; ***, P < 0.001. P values were determined by log-rank test (B), and ANOVA with Bonferroni post hoc test (A, C, D, H, J, and M). MFI, mean fluorescent intensity.

