Figure 7.
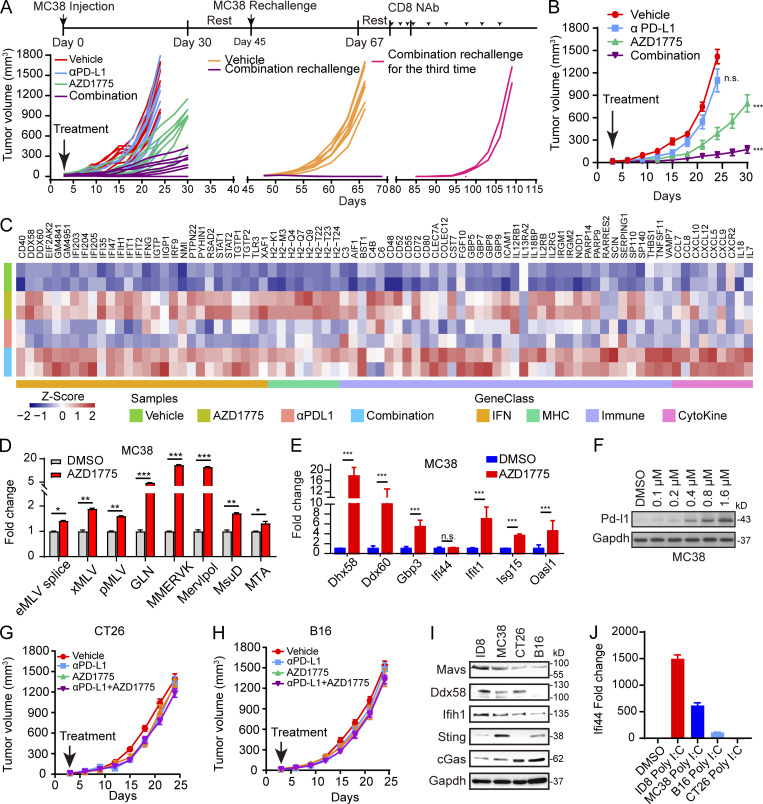
AZD1775 combined with ICB assessment in mouse models. (A) Spider plot of MC38 tumor growth treated as indicated. Each line represents one mouse. (B) Tumor growth curves of MC38 tumors after treatment as indicated (n = 5–9). (C) Heatmap of differential expression of immune genes in MC38 tumor tissues from indicated groups (n = 2 each). (D and E) Quantification of selected ERV (D) and ISG (E) expression by qPCR in MC38 cells treated with AZD1775 or DMSO cells in vitro for 48 h (three independent experiments). (F) Western blot of PD-L1 expression in MC38 cells treated with a series of concentration of AZD1775 or DMSO for 72 h in vitro. Data represent three independent experiments. (G and H) Tumor growth curves of CT26 and B16 tumors after indicated treatment (n = 5 or 6). (I) Western blot of basic expression of dsDNA and dsRNA sensor protein in mouse cells. Data represent three independent experiments. (J) Quantification of IFI44 expression by qPCR in mouse cells treated with poly I:C (5 µg/ml) or DMSO cells for 48 h. The qPCR data were normalized to ACTIN. Data across panels represent mean ± SEM. *, P < 0.05; **, P < 0.01; ***, P < 0.001. P values were determined by unpaired t test (D and E), and ANOVA with Bonferroni post hoc test (B, G, and H).

