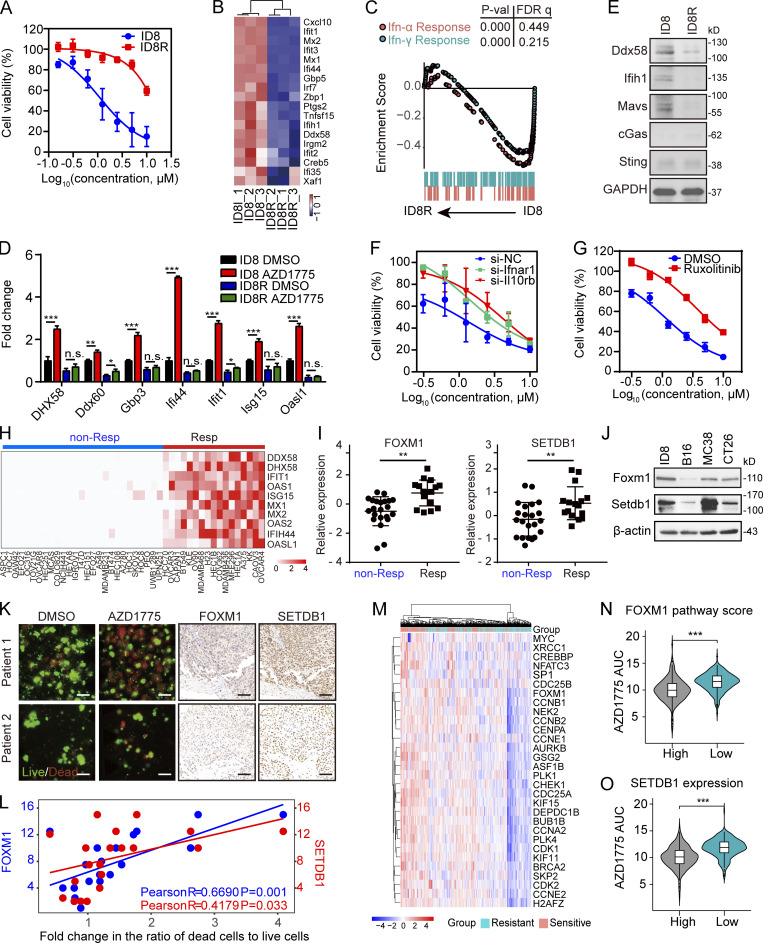
Figure 8.
FOXM1, SETDB1, and IFN pathway activity may be informative biomarkers for response to AZD1775. (A) Cell viability curves of parental or AZD1775-resistant ID8 (ID8R) cells treated with AZD1775 for 72 h (n = 3; three independent experiments). (B) Heatmap of differentially expressed ISGs in parental and ID8R cells. (C) GSEA of HALLMARK-IFN pathways in ID8R cells. (D) Quantification of selected ISGs by qPCR in ID8 and ID8R cells treated with AZD1775 or DMSO for 48 h (three independent experiments). The qPCR data were normalized to β-actin. Data across panels represent mean ± SEM. (E) Western blot of dsDNA and dsRNA sensors in ID8 and ID8R cells. Data represent three independent experiments. (F and G) Cell viability curves of ID8R cells to AZD1775 after transfection of IFNR siRNA or treated with 5 µM ruxolitinib for 48 h (n = 3; three independent experiments). (H) Heatmap of relative expression of selected ISGs (log2[AZD1775/DMSO]) by qPCR in 44 cancer cells (three independent experiments). Cell lines were classified as nonresponse (non-Resp) and response group (Resp) according to the mean fold-changes of ISGs (cutoff = 2). (I) The FOXM1 and SETDB1 levels in nonresponse and response cells are shown (n = 44). (J) Western blot of basic FOXM1 and SETDB1 expression in ID8, CT26, MC38, and B16 cells. Data represent three independent experiments. (K) Representative immunofluorescence images of AO/PI staining (left) in 3D microfluidic ex vivo culture of PDOS after treatment with AZD1775 or DMSO for 24 h, and IHC staining of FOXM1 and SETDB1 (right) in tumor tissues from the same patients (n = 20). (L) Scatter plot of the correlation between the ratio of live to dead cells measured by AO/PI staining and the IHC score of FOXM1 and SETDB1 in 20 ovarian cancer tissues. AO represents live nucleated cells (green). PI represents dead nucleated cells (red). Scale bar, 50 µm. (M) Unsupervised clustering of AZD1775-sensitive (n = 247) or -resistant (n = 247) cancer cells with FOXM1 pathway genes. (N and O) Comparison of AZD1775 sensitivity (AZD1775 AUC: higher AUC means cells were more resistant to AZD1775) according to FOXM1 pathway score (N) or SETDB1 expression (O). High (n = 247) and low (n = 247). *, P < 0.05; **, P < 0.01; ***, P < 0.001; n.s., not significant, as determined by unpaired t test. P-val, P value; FDR q, false discovery rate p-value.

