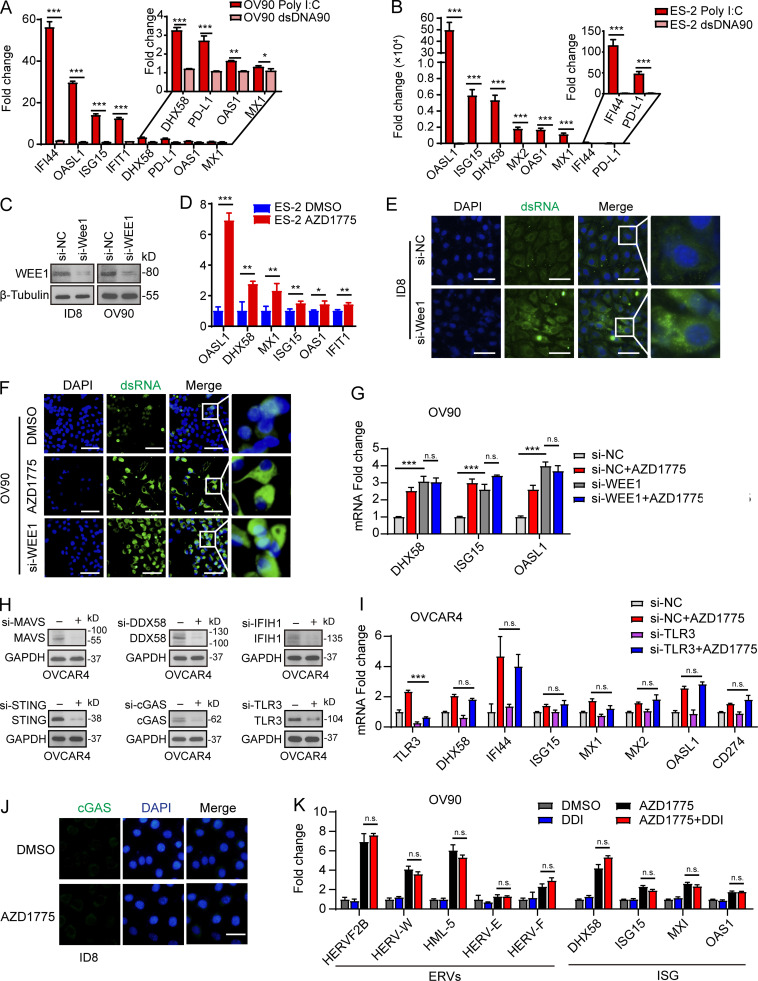
Figure S2.
WEE1 inhibition induces generation of dsRNA and activation of IFN pathway. (A and B) Quantification of the selected ISGs by qPCR in OV90 cells and ES-2 after stimulation with poly I:C or dsDNA90 (n = 2; three independent experiments). (C) Western blot validation of the effect of WEE1 siRNA knockdown in ID8 and OV90 cells. Data represent three independent experiments. (D) Quantification of ISGs by qPCR in ES-2 cells after AZD1775 treatment for 48 h (three independent experiments). (E and F) Cellular dsRNA was evaluated with anti-dsRNA (J2) immunofluorescence in ID8 cells transfected with either si-NC, si-Wee1, or AZD1775 for 72 h. Scale bar, 50 µm (three independent experiments). (G) Quantification of the selected ISGs by qPCR in OV90 cells transfected with either si-NC or si-WEE1 and treated with AZD1775 for 48 h (three independent experiments). (H) Western blot validation of the effect of dsRNA and dsDNA sensors siRNA knockdown in OVCAR4 cells. Data represent three independent experiments. (I) Quantification of the selected ISGs by qPCR in OVCAR4 cells. Cells were transfected with either si-NC or si-TLR3 and treated with AZD1775 for 48 h (three independent experiments). (J) Representative images of immunofluorescence staining of cGAS in ID8 cells treated with DMSO or AZD1775 for 48 h. Scale bar, 20 µm. Data represent three independent experiments. (K) Quantification of the selected ERV and ISGs by qPCR. OV90 cells were treated with DMSO or AZD1775 or didanosine (DDI) or combination for 48 h (three independent experiments). The real-time qPCR data were normalized to β-actin. Data across panels represent mean ± SEM of three independent experiments. *, P < 0.05; **, P < 0.01; ***, P < 0.001. P values were determined by unpaired t test (A, B, and D), and ANOVA with Bonferroni post hoc test (G, I, and K).

