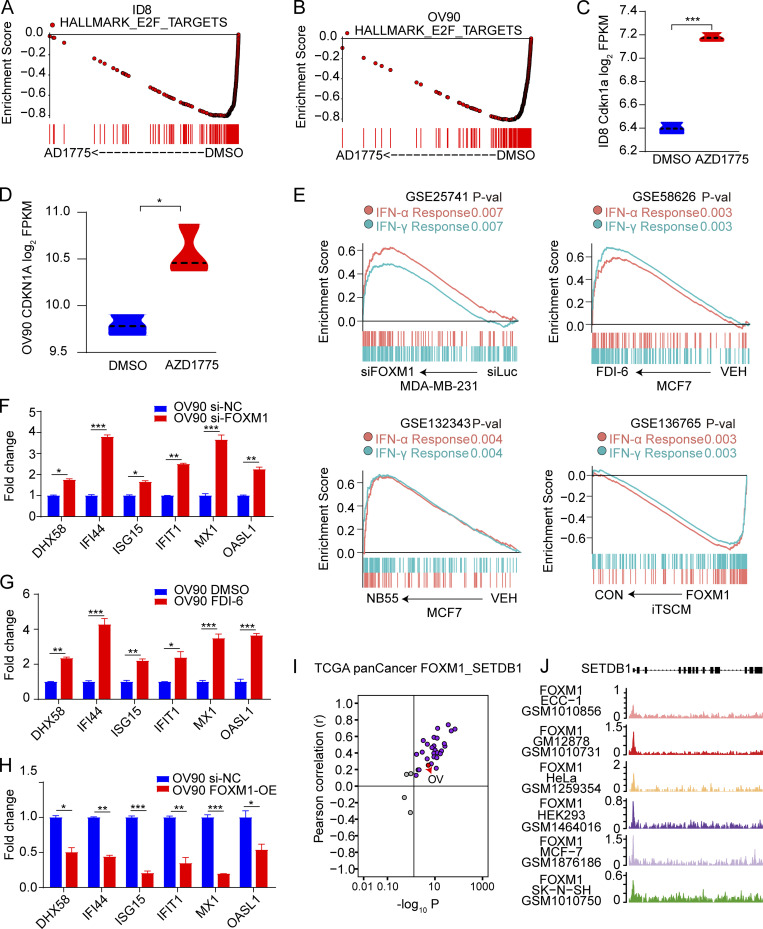
Figure S4.
Association of FOXM1 with SETDB1 and IFN pathway. (A and B) GSEA analysis of enrichment of HALLMARK E2F PATHWAY in RNA-seq data of ID8 and OV90 cells after treatment with AZD1775 or DMSO for 48 h (n = 3). (C and D) The expression of CDKN1A after treatment with AZD1775 or DMSO for 48 h in RNA-seq data of ID8 and OV90 cells (n = 3). (E) GSEA analysis of IFN pathways after inhibition of FOXM1 by siRNA or inhibitors (FDI-6, NB55), or after FOXM1 overexpression (FOXM1; n = 3). (F–H) Quantification of selected ISGs in OV90 cells treated with FOXM1 inhibition (si-FOXM1 or FDI-6) or overexpression (FOXM1-OE; three independent experiments). (I) Pearson’s correlation of SETDB1 and FOXM1 expression in different cancer types from TCGA. Note that every dot represents one cancer type. (J) Screenshot of FOXM1 ChIP-seq tracks of SETDB1 in ECC-1, GM12878, HeLa, HEK293, MCF7, and SK-N-SH cells. Sample numbers are shown (n = 1 each). The qPCR data were normalized to β-actin. Data across panels represent mean ± SEM. *, P < 0.05; **, P < 0.01; ***, P < 0.001, as determined by unpaired t test (C, D, and F–H). FPKM, fragments per kilobase of exon model per million mapped fragments; P-val, P value.

