Figure S5.
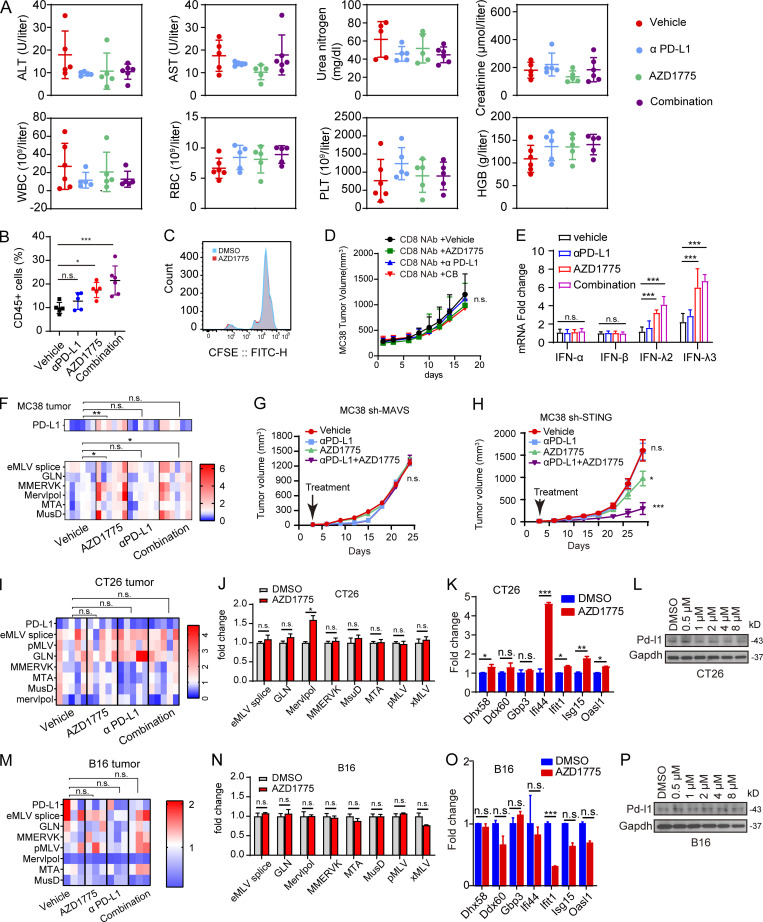
Efficacy of AZD1775, αPD-L1, and combination therapy in ID8, MC38, CT26, and B16 models. (A) Plot of alanine aminotransferase (ALT), aspartate aminotransferase (AST), urea nitrogen, creatinine, white blood cell (WBC), red blood cell (RBC), platelet (PLT) count, and hemoglobin (HGB) levels in mice with ID8 tumors treated with indicated treatments (n = 5 or 6). Data are representative of two independent experiments. (B) Percentage of CD45-positive cells in freshly isolated cells of tumor tissues from ID8 mice treated with indicated treatments analyzed by flow cytometry (n = 5 or 6; two independent experiments). (C) CD8+ T cells were obtained from human blood peripheral blood mononuclear cells using magnetic beads and labeled with CFSE. Then, CD8+ T cells were treated with DMSO or AZD1775 for 4 d. Proliferation activity was detected by flow cytometry with FITC. The data represent three independent experiments. (D) C57BL/6 mice received 200 μg anti-CD8α monoclonal antibody 3 d before MC38 challenge and consolidated on the 0, 3rd, 8th, 14th, 20th, and 26th day after MC38 challenge. These mice were treated from the third day after challenge with indicated treatments. The tumor growth was recorded every 3 d. (n = 5–7). (E) Quantification of IFNs in MC38 tumors treated with vehicle, AZD1775, αPD-L1, or combination (n = 5–7). (F) Heatmap of normalized expression of PD-L1 and selected ERVs versus β-actin in MC38 tumors treated with indicated treatments (n = 5 or 6). (G and H) Tumor growth curves of MAVS and STING-defective MC38 treated with indicated treatments (n = 5). (I and M) Heatmap of normalized expression of PD-L1 and selected ERVs versus β-actin in CT26 (n = 5) and B16 (n = 3) tumors treated with indicated treatments. (J and O) Quantification of selected ERVs (J and N) and ISGs (K and O) expression by qPCR in CT26 and B16 cells treated with AZD1775 or DMSO cells for 48 h in vitro (three independent experiments). (L and P) Western blot of PD-L1 expression in CT26 and B16 cells treated with a series of concentration of AZD1775 or DMSO. Three independent experiments. The qPCR data were normalized to β-actin. Data across panels represent mean ± SEM. *, P < 0.05; **, P < 0.01; ***, P < 0.001. P values were determined by unpaired t test (J, K, N, and O) and ANOVA with Bonferroni post hoc test (B, D–I, and M).

