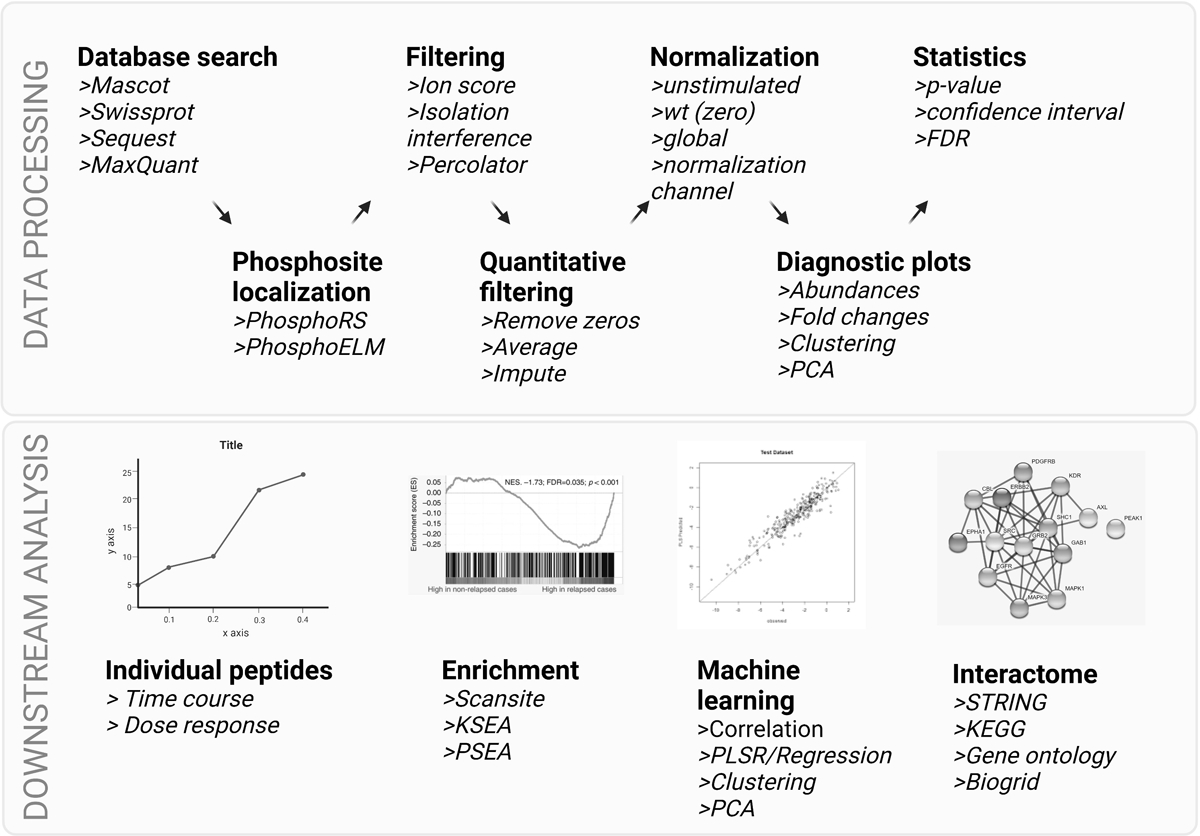
Figure 3.

Steps in data processing and downstream analysis tools for phosphoproteomic data. Top: multiple data processing steps are needed in order to identify and quantify phosphorylation sites from MS/MS data, including database searching, site localization and quality filtering for identifications. Depending on the quantitative method, data may go through additional filtering, normalization, clustering, and statistical analysis as a first pass at identifying differentially phosphorylated peptides. Bottom: more nuanced biological information can be gained through additional computational analysis, including temporal analysis, kinase / substrate or pathway enrichment of phosphorylation subsets, and machine learning approaches to identify modules and pathways of phosphorylation-mediated signaling networks. Each of these tools can lead to predicted functions for phosphorylation sites in the data. Validation experiments should be performed to confirm analysis results. Created with BioRender.com
