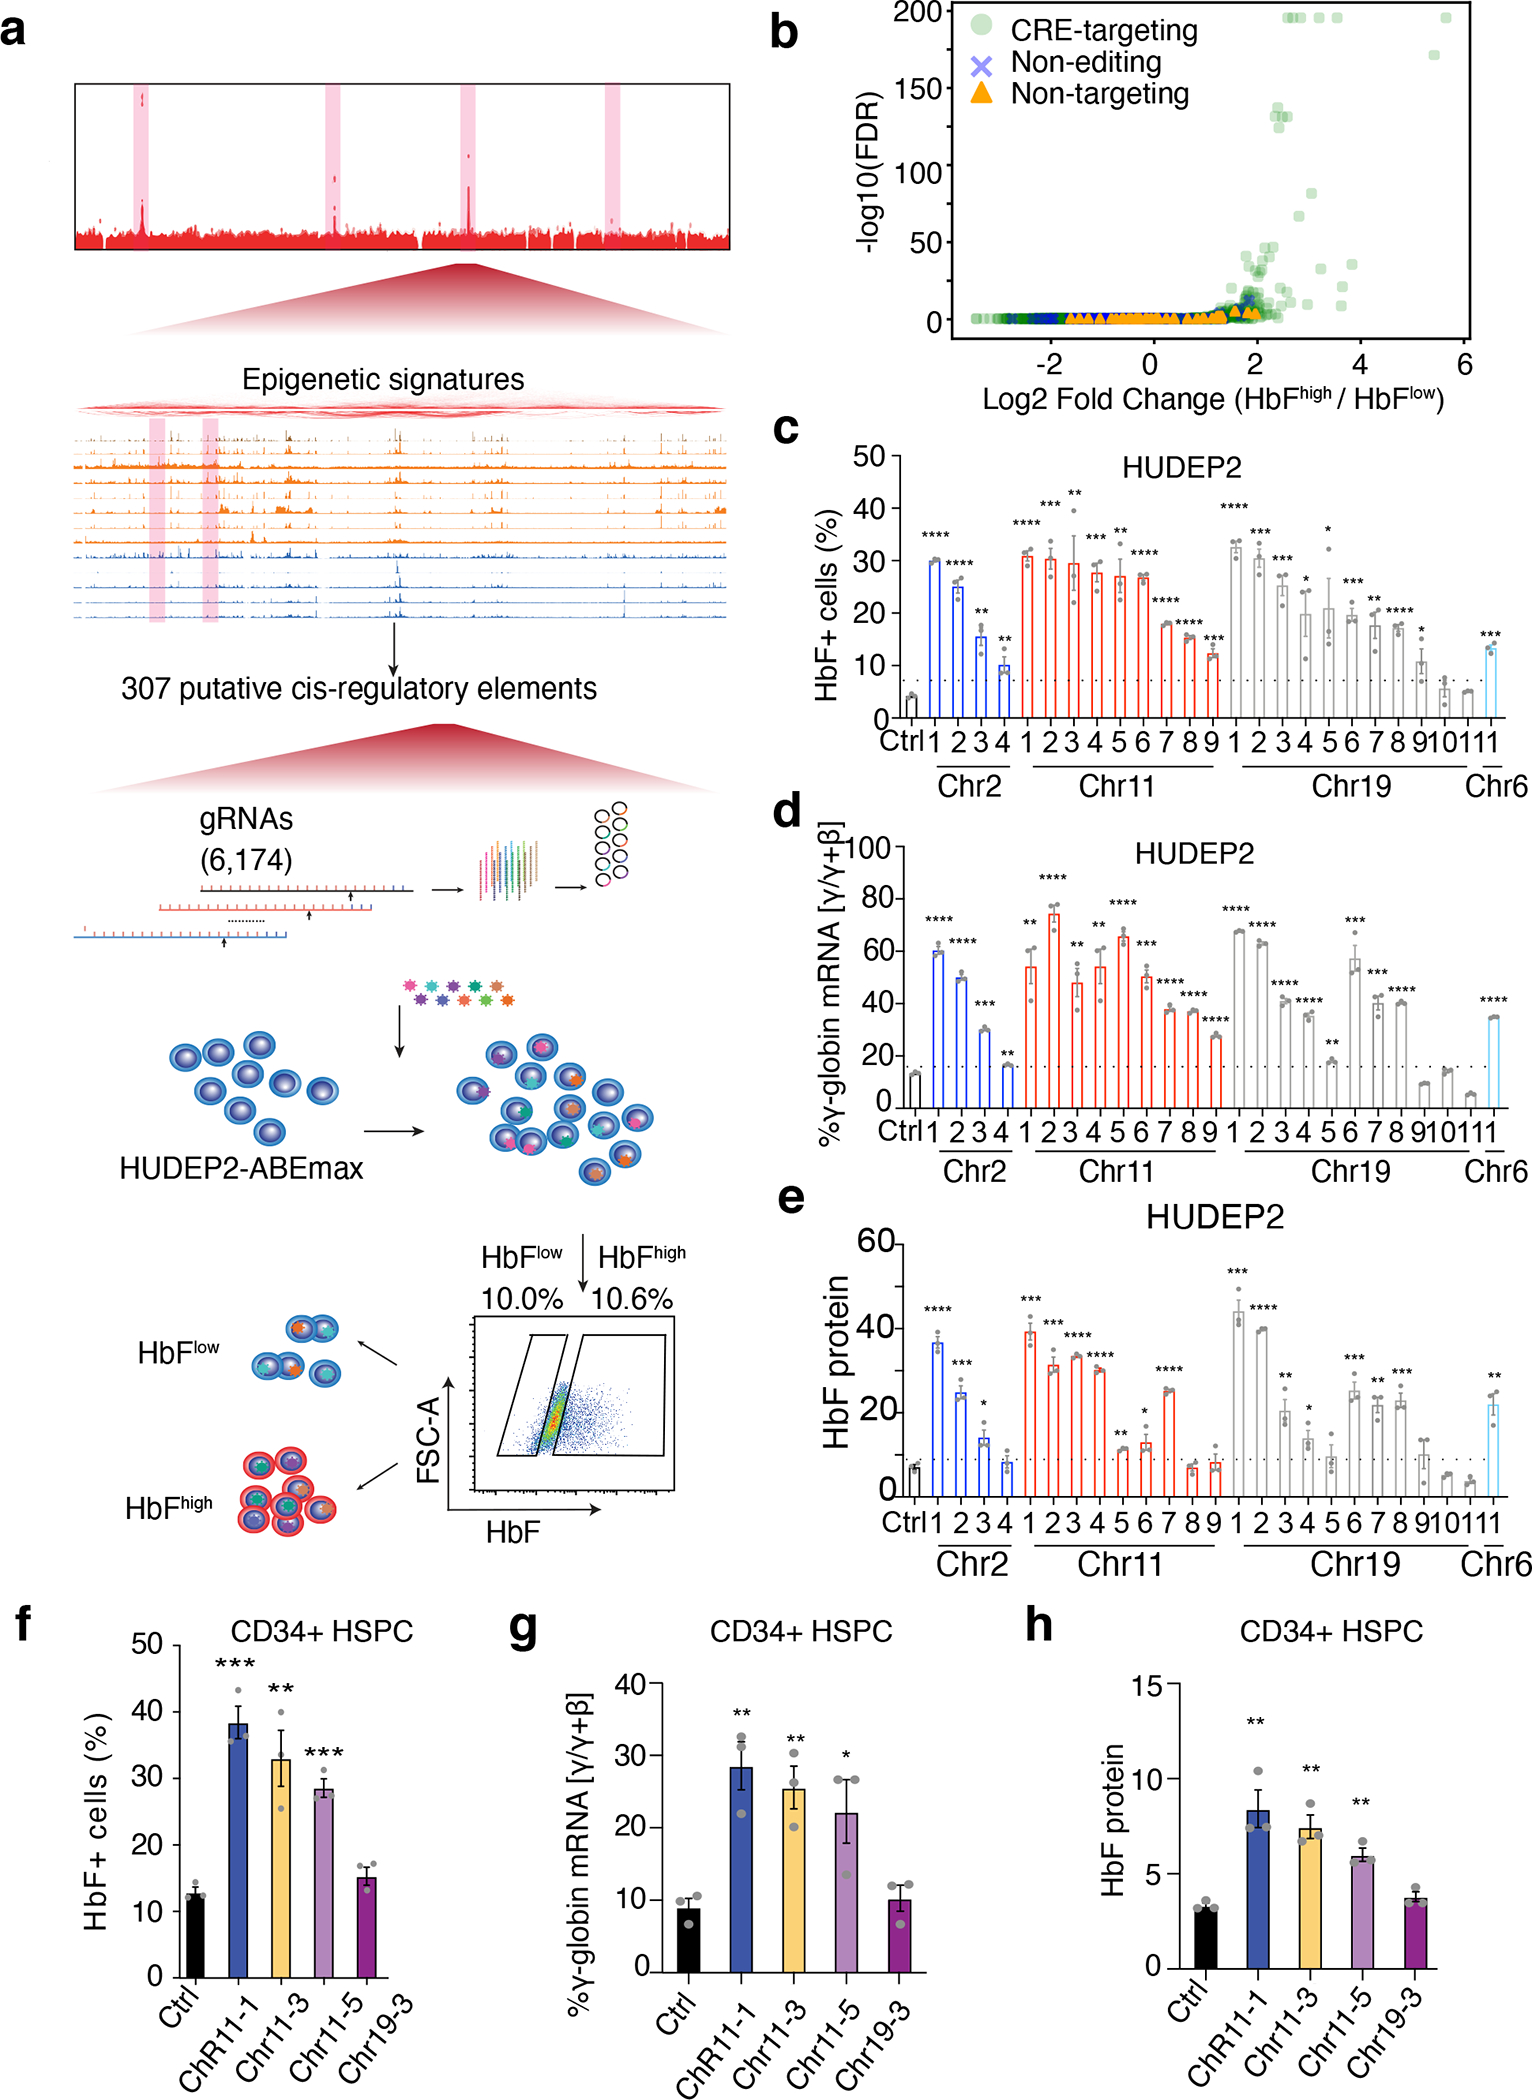
Figure 2. High-throughput ABEmax perturbation identifies CREs that control HbF expression.

(a) Schematic representation of the workflow showing bioinformatics-informed gRNA library construction, mutagenesis, and selection for HbFhigh and HbFlow phenotypes.
(b) Differential representation of individual targeting gRNAs in HbFhigh and HbFlow populations as a volcano plot. Each dot represents a single gRNA. The x-axis shows the log fold-difference and the y-axis shows the −log10(FDR). Light green dots, CRE-targeting gRNAs; Blue crosses, non-editing control gRNAs; orange triangles, non-targeting control gRNAs.
(c–e) Validation studies of top-hit gRNAs in HUDEP-2 cells. HUDEP-2–ABEmax cells were treated with a non-targeting control (Ctrl) gRNA or with randomly chosen individual candidate gRNAs that were identified as top screening hits by their over-representation in HbFhigh cells. The chromosome locations of each gRNA are shown on the x-axis.
(c) F-cell fractions measured by immuno-flow cytometry.
(d) The percentage of γ-globin mRNA as determined by real-time RT-qPCR.
(e) The hemoglobin F fraction measured by IE-HPLC.
(f–h) Validation studies of top-hit gRNAs in normal donor CD34+ HSPC–derived erythroblasts. CD34+ cells were transfected with RNP complexes consisting of ABEmax + non-targeting control (Ctrl) gRNA or individual top-hit gRNAs, grown in culture under conditions that support erythroid differentiation, and analyzed after 14 days.
(f) F-cell fractions measured by immuno-flow cytometry.
(g) The percentage of γ-globin mRNA as determined by real-time RT-qPCR.
(h) The hemoglobin F fraction measured by IE-HPLC.
****P < 0.0001, ***P < 0.001, **P < 0.01, *P < 0.05, were determined using two-tailed unpaired t-test (Exact P values for each test are listed in source data). Bar plots show mean ± S.E.M. of three independent experiments.
