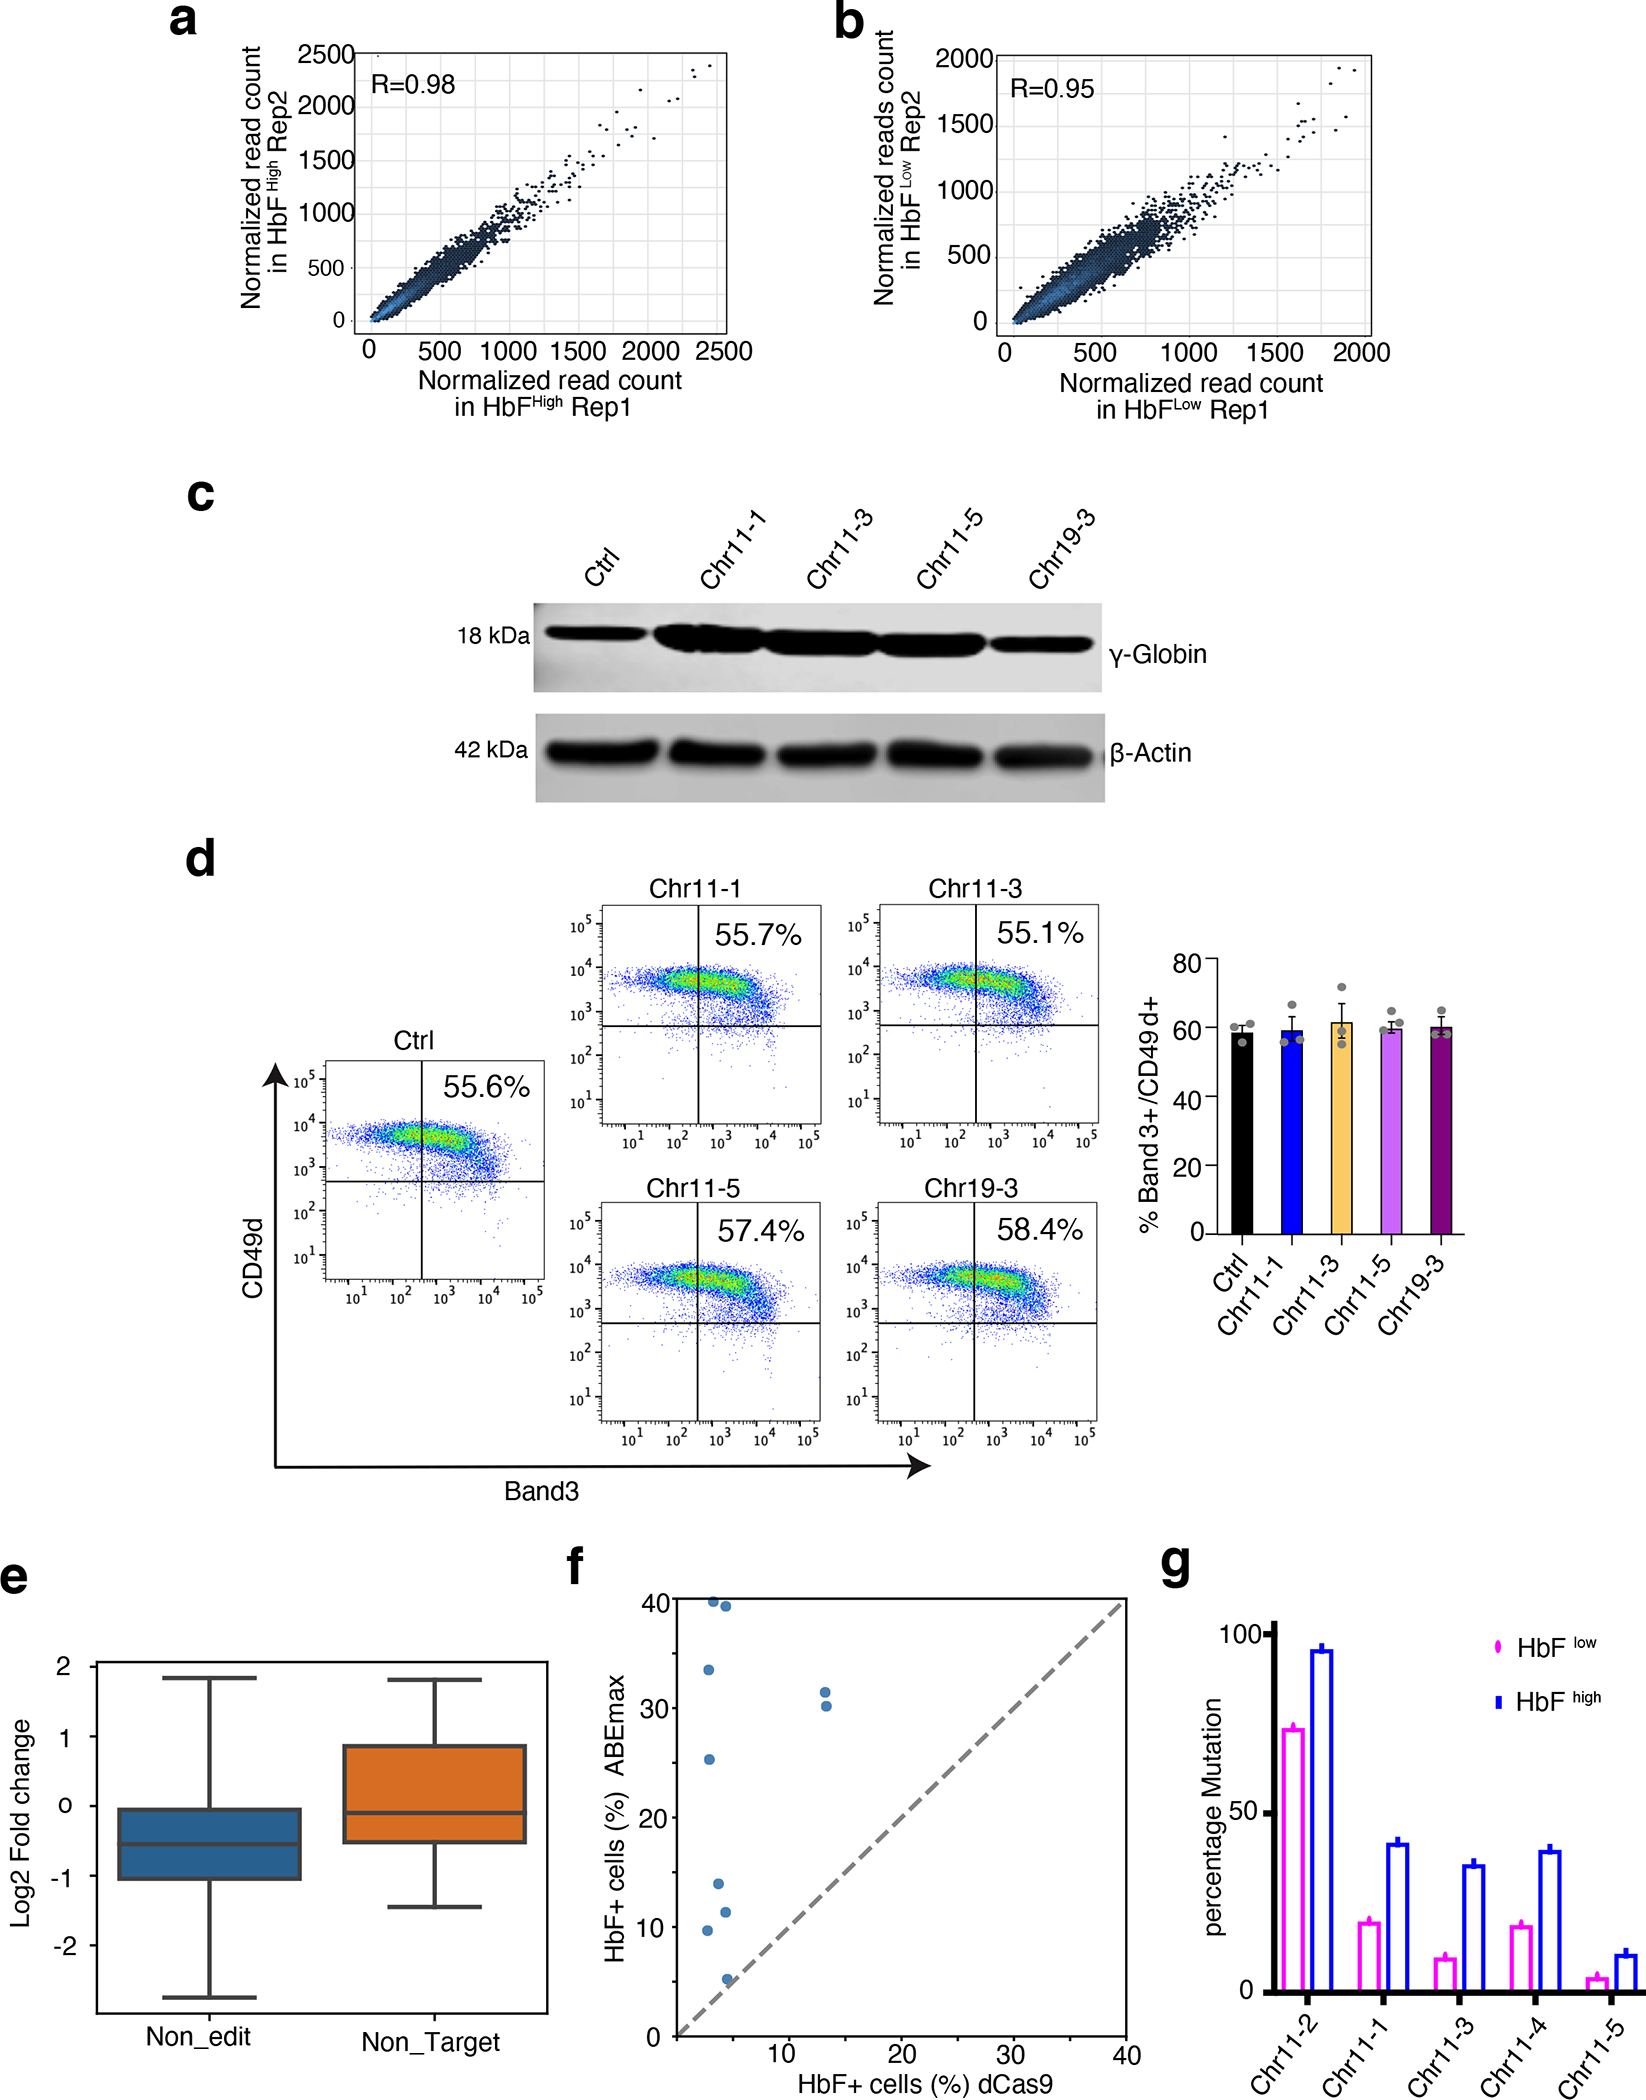
Extended Data Fig. 2. High-throughput mapping of CREs regulating HbF in HUDEP-2 cells and single-gRNA validation in CD34+ HSPCs.

(a,b) Dot plots showing the correlation between two biological replicates of ABE screens for the HbFhigh (a) and HbFlow (b) cell populations. Each dot represents one gRNA; the x- and y-axes represent the normalized read counts.
(c,d) Validation studies of top-hit gRNAs in normal donor CD34+ HSPC–derived erythroblasts. CD34+ cells were transfected with RNP complexes consisting of ABEmax + non-targeting control (Ctrl) gRNA or individual top-hit gRNAs and analyzed after 12 days of erythroid differentiation.
(c) HbF protein levels measured by Western blot analysis. The result is representative of three independent experiments. (Image was cropped from source data Fig. 4)
(d) Flow-cytometry plots showing the expression of the RBC maturation markers Band3 and CD49d after 12 days of differentiation (left) and a bar chart summarizing the results from three replicates (right). Error bars represent the mean +/− S.E.M from three independent experiments.
(e) Boxplot comparing the HbF effects of gRNAs without editable adenines (n=112) and none targeting control gRNAs (n=20). Y-axis is log2 ratio of gRNA reads counts between HbFhigh and HbFlow cells. P-value was determined by unpaired two-tailed Wilcoxon test. Box depicts the interquartile range; central line indicates the median and whiskers indicate minimum/maximum values.
(f) Scatterplot showing the F-cell fractions measured by immune-flow cytometry in HUDEP-2- ABEmax and HUDEP-2-dCas9 cells transfected with 10 gRNAs. Each dot represents one gRNA.
(g) Comparison of target site mutation frequencies in HbFhigh and HbFlow cells. Cells were treated with ABEmax and 5 different gRNAs and then sorted based on HbF levels after 5 days differentiation. The frequencies are calculated based on one argeted deep-sequencing result.
