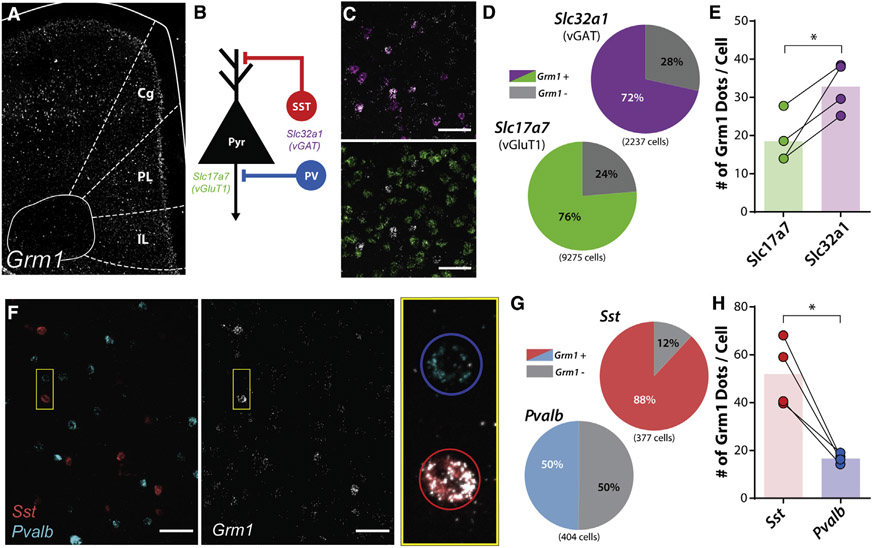
Figure 1. mGlu1 expression is enriched in prelimbic cortical somatostatin interneurons.
(A) In situ hybridization of Grm1 mRNA in a coronal slice containing the mouse mPFC with regions outlined in white. Cg, cingulate; PL, prelimbic; IL, infralimbic.
(B) Simplified schematic of cortical microcircuitry with mRNA markers for each neuronal population including glutamatergic pyramidal neurons (Pyr; Slc17a7, mRNA for vGluT1) and GABAergic interneurons (Slc32a1, mRNA for vGAT), consisting of somatostatin (SST)-positive (Sst), and parvalbumin (PV)-positive interneurons (Pvalb).
(C) Representative images of deep layer V PL PFC. (Top) Colocalization of Slc32a1 (magenta) and Grm1 (white) mRNA. (Bottom) Colocalization of Slc17a7 (green) and Grm1 mRNA. Scale bars, 50 μm.
(D) Percentage of Grm1 mRNA colocalization with Slc32a1- and Slc17a7-positive cells. A greater proportion of Slc17a7-positive cells were Grm1-positive compared to Slc32a1-positive cells (Grm1/Slc17a7-posiitve cells, 7,079/9,275; Grm1/Slc32a1-positive cells, 1,600/2,237; two-sided Fisher’s exact test, p < 0.0001).
(E) Quantification of number of Grm1 mRNA puncta (dots) per Slc32a1- and Slc17a7-positive cell (two-tailed paired t test, p = 0.023, N = 4 mice).
(F) Representative images of deep layer V PL PFC. (Left) Sst-positive (red) or Pvalb-positive (cyan) cells. (Middle) Same image displaying Grm1 mRNA (white). (Right) Magnification of pair of cells outlined in yellow box with Grm1, Sst, Pvalb mRNA overlaid. SST-positive neuron outlined in red circle; PV-positive neuron outlined in blue circle. Scale bars, 50μm.
(G) Percentage of Grm1 mRNA colocalization with Sst- and Pvalb-positive cells. A greater proportion of Sst-positive cells was Grm1-positive compared to Pvalb-positive cells (Grm1/Sst-positive cells, 332/377; Grm1/Pvalb-positive cells, 201/404; two-sided Fisher’s exact test, p < 0.0001).
(H) Quantification of number of Grm1 mRNA puncta (dots) per Sst- and Pvalb-positive cell (two-tailed paired t test, p = 0.015, N = 4 mice). *p < 0.05.
See also Figure S1.

