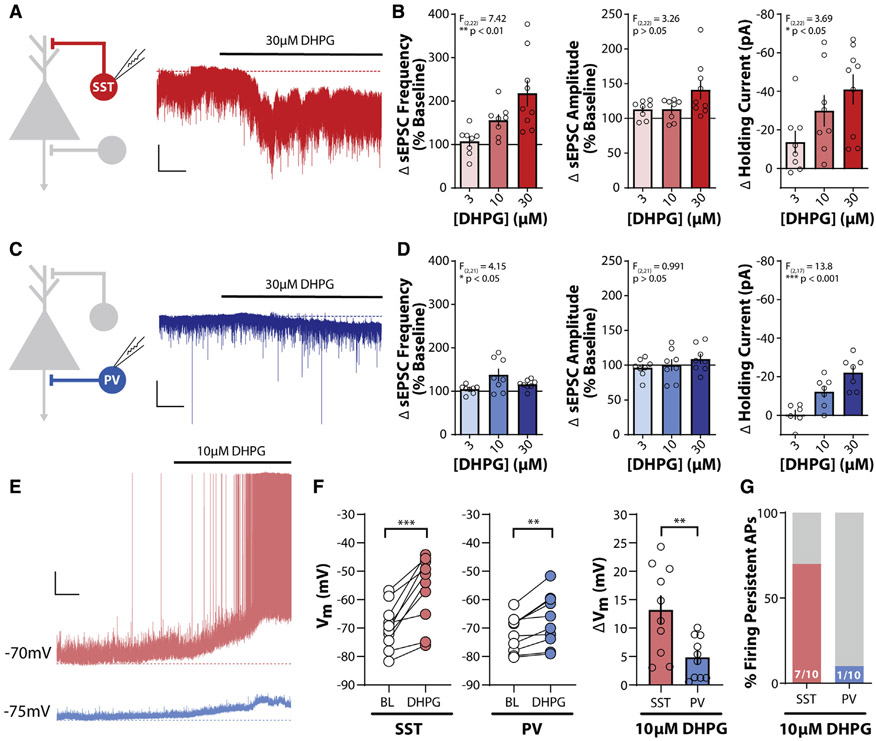
Figure 2. mGlu1 activation enhances SST interneuron output in the PL PFC.
(A) (Left) Schematic depicting whole-cell recording of SST-INs. (Right) Sample trace of voltage-clamp recording of an SST-IN in response to bath application of the mGlu1/5 agonist DHPG (30 μM), represented by bold black line above trace. All experiments were conducted in the constant presence of the mGlu5 negative allosteric modulator MTEP (3 μM). Dashed red line represents baseline holding current. Scale bars, 50 pA, 50 s.
(B) DHPG induces a concentration-dependent increase in sEPSC frequency (one-way ANOVA main effect of DHPG concentration, F(2,22) = 7.42, p = 0.0034), sEPSC amplitude (one-way ANOVA main effect of DHPG concentration, F(2,22) = 3.26, p = 0.058), and holding current, Ih (one-way ANOVA main effect of DHPG concentration, F(2,22) = 3.69, p = 0.042) in SST-INs (n/N = 8/5, 8/3, and 9/7 cells/mouse for 3, 10, and 30 μM DHPG).
(C) (Left) Schematic depicting whole-cell recording of PV-IN. (Right) Sample trace of voltage-clamp recording of a PV-IN as in (A). Dashed blue line represents baseline holding current. Scale bars, 50 pA, 50 s.
(D) Change in sEPSC frequency (one-way ANOVA main effect of DHPG concentration, F(2,21) = 4.15, p = 0.030), sEPSC amplitude (one-way ANOVA main effect of DHPG concentration, F(2,21) = 0.991, p = 0.38), and holding current (one-way ANOVA main effect of DHPG concentration, F(2,17) = 13.80, p = 0.0003) in response to bath application of DHPG in PV-INs (n/N = 8/4, 8/4, and 8/5 for 3, 10, and 30 μM DHPG effects on sEPSCs. n/N = 6/4, 7/4, and 7/5 for 3, 10, and 30 μM DHPG effects on Ih).
(E) Sample traces of current-clamp recordings from an SST-IN (red) and PV-IN (blue) in response to bath application of 10 μM DHPG. Dashed lines represent baseline membrane potential. Scale bars, 10 mV, 1 min.
(F) DHPG (10 μM) depolarizes the membrane potential in SST-INs (left) and PV-INs (middle) (two-tailed paired t test, SST: p = 0.0005, PV: p = 0.0024; n/N = 10/4 per cell type). (Right) Greater depolarization was observed in SST-INs relative to PV-INs (two-tailed Student’s t test, p = 0.0066, n/N = 10/4 per cell type).
(G) A greater percentage of SST-INs fire persistent action potentials in response to 10 μM DHPG. Number of cells responding/total cells recorded denoted in each bar. Two-sided Fisher’s exact test, p = 0.020. **p < 0.01, ***p < 0.001.
Data are represented as mean ± SEM. See also Figure S2.

